


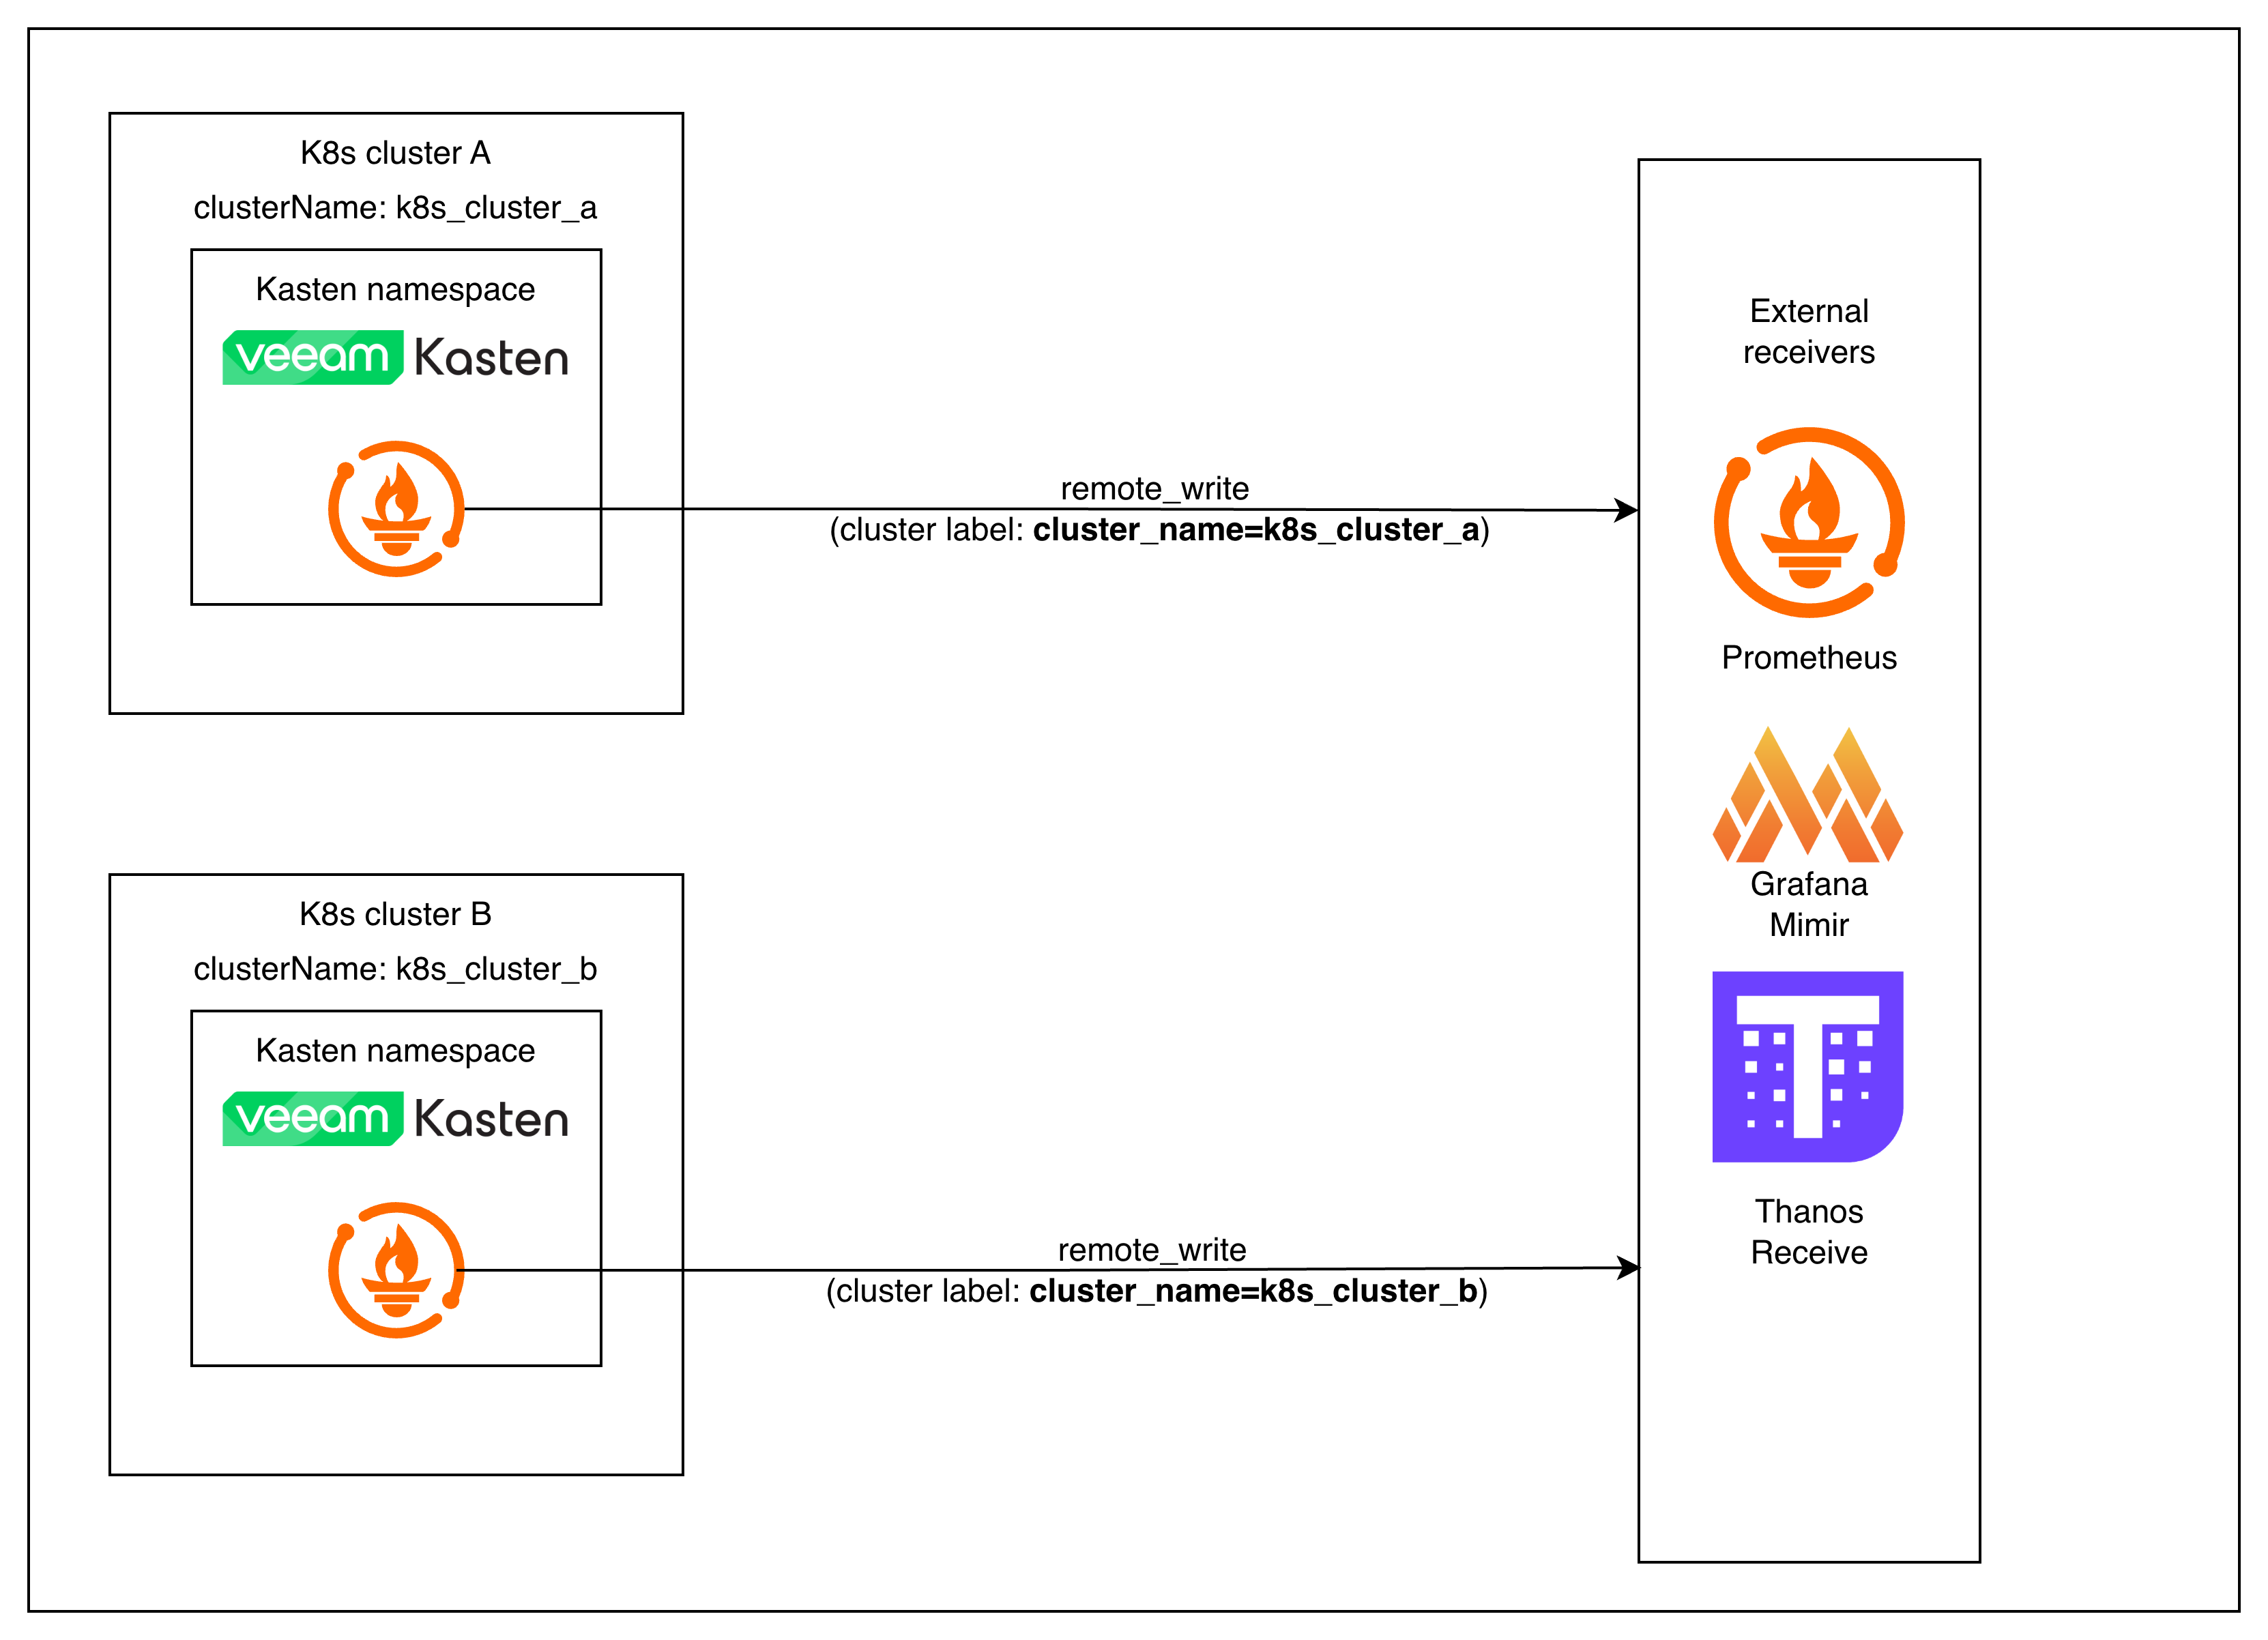
Starting with Veeam Kasten v8.5.0, the in‑cluster Prometheus can push metrics directly to an external backend using Prometheus remote_write — no more sidecars, exporters, or custom agents.
In older Kasten (K10) versions, getting metrics out of the cluster often meant extra components and ad‑hoc wiring. Now, remote write is a first‑class Kasten setting in both the Helm chart and the Operator. This matters if you want a centralized place to query Kasten health across environments and retain metrics longer without maintaining a separate Prometheus stack per cluster.
Once remote_write is configured, Kasten’s Prometheus can ship metrics to any backend that speaks the standard Prometheus remote_write protocol, including:
- Grafana Cloud
- Thanos Receive
- Cortex / Mimir
- Any managed or self‑hosted backend that supports Prometheus remote writes
Why remote_write instead of external Prometheus pulling the metrics directly?
Prometheus is built around a pull model, but pulling directly from Kasten’s in-built prometheus adds operational overhead:
- You’d need to expose Kasten’s Prometheus externally or federate it.
- Scrape configs must be kept in sync across clusters.
- Authentication and TLS get more complicated.
With remote_write, we send only the filtered metrics you need. No scraping or service exposure, and one config works across all your clusters. The push model suits this use-case better.
This guide is the first piece of a three‑part series focused on building an end‑to‑end, backend‑agnostic monitoring setup for Kasten:
-
Part 1 (this post): Prometheus Remote Write Configuration with Kasten.
-
Part 2: Customizing the Public Kasten Grafana Dashboard for Multi‑Cluster Visibility.
-
Part 3: Setting up alerting based on Kasten’s exported metrics.
By the end of the series, you’ll have a repeatable pattern for exporting Kasten metrics from multiple clusters, visualizing them in Grafana, and wiring up alerts.
Requirements
Before jumping into configuration, make sure you have:
Kubernetes & Kasten
- A Kubernetes cluster running a version supported by Kasten with Kasten v8.5.0 or later installed
- Access to upgrade the Helm release or modify the Kasten operand
Prometheus / Remote Write Receiver
- An endpoint that supports Prometheus remote_write.
- One of the following authentication methods (depending on the receiver):
- Basic Auth (username/password).
- Bearer Token.
- Custom Authorization header.
- Optional: Root CA for TLS if your endpoint uses non‑standard or self‑signed certificates.
What This Guide Does Not Cover
To keep this part focused on remote writes, we’re intentionally not covering:
- Installing or upgrading Kasten itself.
- Running or tuning your own Prometheus stack.
- Managing or scaling the external metrics backend.
- Alerting, which we will cover in the next parts of the series.
- Long‑term logging or dashboarding strategies.
This post is strictly about setting up a reliable metrics pipeline out of the cluster.
Metrics Customization
Relabeling: exporting only the metrics you actually care about
By default, Prometheus will remote write everything it scrapes, including internal Kasten and Prometheus metrics.
The write_relabel_configs in the examples intentionally keep only Kasten-specific metrics you care about so you don’t flood the receiver with unrelated samples or explode label cardinality. Refer to this Kasten documentation page for an overview of the metrics that it exposes.
write_relabel_configs:
  - action: keep
    source_labels: [__name__]
    regex: |
      action_.*
      |.*_persistent_volume_.*
      |repository_data_.*
      |data_operation_.*
      |data_upload_session_.*
      |exec_.*
      |limiter_.*
      |export_storage_.*
      |snapshot_storage_.*
      |metering_license_.*
      |events_service_.*
      |process_.*
      |compliance_count
If you skip relabeling, Prometheus will happily ship every scraped metric — including its own internals and anything else running in the Kasten namespace. That’s a fast path to high costs, noisy dashboards, and cardinality issues in your remote backend.
What this does
-
source_labels: [__name__]— we’re matching on the metric name. -
action: keep— only metrics whose names match the regex are kept for remote write; everything else is dropped. regex: …— a list of name patterns that cover the Kasten signals you care about (backup actions, repositories, upload sessions, controller processes, etc.). Roughly speaking, this regex keeps:action_*and*_persistent_volume_*– backup and restore actions, plus the PVC level usage metrics.repository_data_*,data_operation_*,data_upload_session_*– repository usage and data movement metrics.exec_*,limiter_*,events_service_*,process_*– controller/process/execution control metricsexport_storage_*,snapshot_storage_*– snapshot/export storage metrics.metering_license_*,compliance_count– licensing and compliance summary metrics.
This keeps the remote stream lean and focused on Kasten’s operational metrics. This is an example starting set; you should review and adapt it for your needs. You can extend or narrow the regex depending on what metrics you want exported.
If you prefer, you can split this into multiple write_relabel_configs rules to make the configuration easier to maintain.
ClusterName label
One thing you don’t need to add manually is a relabel rule for attaching a cluster identifier.
Kasten automatically injects a clusterName label into every metric it emits.
This value comes directly from the Helm chart’s clusterName field.
This becomes essential when you build multi‑cluster dashboards and alerts.
helm upgrade
Setup
The steps below all follow the same pattern, regardless of auth method:
- Create Kubernetes Secrets for credentials or certificates.
- Reference those secrets in your Kasten Helm values.
- Run a Helm upgrade to apply the configuration.
Authentication Customization
The official Kasten documentation covers the general Prometheus remote_write configuration and common authentication patterns like Basic Auth and Bearer token auth.
This guide complements it by showing examples for
- Custom Authorization Header (API key or custom scheme)
- TLS with custom or self‑signed CA certificates
Each example follows the same structure so you can plug in whichever method your metrics backend expects.
Custom Authorization Header
Use this when the backend requires something other than Authorization: Bearer <token>.
Examples:
- API keys that must use a custom header format
(e.g.,Authorization: ApiKey <key> or X-API-Key: <key>) - Gateways that enforce non‑standard schemes
- Internal ingestion services that are Prometheus-compatible but not Prometheus-native
Create Kubernetes secret for Prometheus remote write custom auth token credentials
kubectl create secret generic prometheus-remote-write-creds \
  --namespace kasten-io \
  --from-literal=apikey=apikeyxxxxxx
Helm values with custom token header
  clusterName: <Cluster-Unique-Name>
  prometheus:
    server:
      extraSecretMounts:
      - name: remote-write-creds
        mountPath: /etc/prometheus/secrets
        secretName: prometheus-remote-write-creds
      remote_write:
      - authorization:
          type: "ApiKey" # or any other scheme your backend expects
          credentials_file: /etc/prometheus/secrets/apikey
        url: https://<remote-write-endpoint>/path/to/receive
        write_relabel_configs:
        - action: keep
          regex: action_.*|.*_persistent_volume_.*|repository_data_.*|data_operation_.*|data_upload_session_.*|exec_.*|limiter_.*|export_storage_.*|snapshot_storage_.*|metering_license_.*|events_service_.*|process_.*|compliance_count
          source_labels: [__name__]
TLS CA File (self‑signed or private certificate)
Use this if the remote_write endpoint does not use a publicly trusted certificate. Typical scenarios:
- Internal Thanos Receive with a self-signed certificate
- In-cluster Mimir/Cortex using internal PKI
- Corporate‑issued certificates not trusted by default
- Any endpoint where you see:
“x509: certificate signed by unknown authority”
TLS config is independent of the auth method. The example below shows it combined with a basic auth, but you can pair tls_config with bearer token, custom authorization headers, or no auth at all.
Create a secret with the root CA and intermediate CAs (if needed)
kubectl create secret generic prometheus-ca-cert-secret \
  --from-file=ca.crt \
  -n kasten-io
Helm values with Custom Authorization Header and TLS certificate
  clusterName: <Cluster-Unique-Name>
  prometheus:
    server:
      extraSecretMounts:
      - name: remote-write-creds
        mountPath: /etc/prometheus/secrets
        secretName: prometheus-remote-write-creds
      - name: remote-write-certificate
        mountPath: /etc/prometheus/secrets/tls-certs
        secretName: prometheus-ca-cert-secret
      remote_write:
      - tls_config:
          ca_file: /etc/prometheus/secrets/tls-certs/ca.crt
        authorization:
          type: "ApiKey" # or any other scheme your backend expects
          credentials_file: /etc/prometheus/secrets/apikey
        url: https://<remote-write-endpoint>/path/to/receive
        write_relabel_configs:
        - action: keep
          regex: action_.*|.*_persistent_volume_.*|repository_data_.*|data_operation_.*|data_upload_session_.*|exec_.*|limiter_.*|export_storage_.*|snapshot_storage_.*|metering_license_.*|events_service_.*|process_.*|compliance_count
          source_labels: [__name__]
If You Deploy Kasten via the Operator
The examples in this post use Helm because it’s the simplest and most common way to configure remote writes in Kasten. But if you’re running Kasten via the Kasten Operator, the same remote write configuration still applies — it just lives under the spec field of the Kasten operand.
spec:
  <helmValues>
Conceptually, you can think of the Operator mapping like this:
prometheus.server.*→spec.prometheus.server.*clusterName→spec.clusterName
A typical Operator patch file with the configuration for custom auth header and TLS certs looks like this:
spec:
  clusterName: <Cluster-Unique-Name>
  prometheus:
    server:
      extraSecretMounts:
      - name: remote-write-creds
        mountPath: /etc/prometheus/secrets
        secretName: prometheus-remote-write-creds
      - name: remote-write-certificate
        mountPath: /etc/prometheus/secrets/tls-certs
        secretName: prometheus-ca-cert-secret
      remote_write:
      - tls_config:
          ca_file: /etc/prometheus/secrets/tls-certs/ca.crt
        authorization:
          type: "ApiKey" # or any other scheme your backend expects
          credentials_file: /etc/prometheus/secrets/apikey
        url: https://<remote-write-endpoint>/path/to/receive
        write_relabel_configs:
        - action: keep
          regex: action_.*|.*_persistent_volume_.*|repository_data_.*|data_operation_.*|data_upload_session_.*|exec_.*|limiter_.*|export_storage_.*|snapshot_storage_.*|metering_license_.*|events_service_.*|process_.*|compliance_count
          source_labels: [__name__]
To apply it, save the patch as patch.yaml and run:
kubectl patch k10s.apik10.kasten.io k10 \
  -n kasten-io \
  --type=merge \
  --patch-file patch.yaml
That’s effectively the Operator equivalent of running a helm upgrade with updated values.
Verifying That Remote Write is Working
Once you’ve updated your Kasten configuration and rolled out the change (via helm upgrade or an Operator patch), you should verify that metrics are actually making it to your remote backend. The exact UI will vary by platform (Grafana, Grafana Cloud, Thanos, Cortex/Mimir, etc.), but the overall steps are the same.
Confirm in‑cluster Prometheus is healthy
First, make sure the Kasten Prometheus server isn’t failing the remote write:
kubectl logs -n kasten-io deploy/k10-prometheus-server | grep -i "remote_write" -A3 -B3
You’re looking for:
- No repeated errors like x509: certificate signed by unknown authority or authentication error.
- Occasional log lines indicating successful remote write batches (wording varies by Prometheus version, but they should not be consistently erroring).
If you see persistent errors, fix those before moving on (usually TLS or credentials).
Run a simple PromQL query in your remote backend
Next, open the query UI for your remote backend (Prometheus, Grafana Explore, or the equivalent) and run a basic PromQL query that:
- Targets a known Kasten metric
- Filters on your Kasten cluster’s
clusterNamelabel
For example:
catalog_persistent_volume_free_space_percent{clusterName="<Cluster-Unique-Name>"}
Any metric name that matches your write_relabel_configs regex will work here.
If remote write is working, you should see:
- One or more time series returned.
- Recent timestamps (not stale data).
- A
clusterNamelabel with the value you configured in your Kasten Helm values or Operator spec.
Conclusion
That’s the entire remote write setup. Once you’ve updated your Kasten values and run a Helm upgrade (or patched the Kasten operand), Kasten’s in‑cluster Prometheus starts streaming a curated set of Kasten metrics to your remote backend — with a consistent clusterName attached.
You’ve effectively turned Kasten into a first‑class citizen of your central observability stack, without maintaining a separate Prometheus just for backups.
From here, you don’t need to think about “Kasten’s internal Prometheus” anymore. You can treat Kasten like any other workload exposing Prometheus metrics into your central stack.
In Part 2, we’ll take Kasten’s public Grafana dashboard, layer in multi‑cluster support, and show how to reuse it across environments. In Part 3, we’ll focus on alerts that actually map to “backup is healthy” rather than low-level noise.


