


Why bring Kasten metrics into Splunk?
Kasten K10 exposes rich Prometheus metrics across its services (catalog, jobs, etc.). Many teams already standardize on Splunk for operational insights and alerting. Bridging these worlds lets you:
- Centralize Kasten observability alongside app, infra, and security data
- Reuse existing Splunk practices, RBAC, and alerting
- Build durable dashboards mirroring your Prometheus views
- Simplify triage: failed backups, job latencies, capacity signals — all in one place
This post explains the approach I use in the kasten-splunk project to collect Kasten metrics via Prometheus’ federate endpoint, ingest them into a Splunk metrics index with OpenTelemetry, and reconstruct key PromQL logic with SPL.
Project: https://github.com/michaelcourcy/kasten-splunk
Architecture at a glance
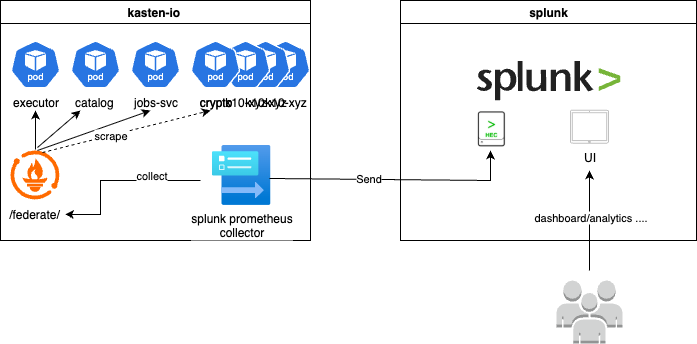
- Every Kasten component emits Prometheus metrics
- A Prometheus server scrapes these metrics every few seconds
- The Prometheus
federate/endpoint exposes the scraped series - An OpenTelemetry Collector reads from
federate/and writes to a Splunk metrics index (for example,k8s_metrics) - Splunk users query and visualize Kasten metrics with SPL
Setup
You’ll find working manifests in the project repository. The steps below are for OpenShift, using the oc CLI.
1) Deploy a Splunk instance with a metrics index and HEC secrets
oc create -f https://raw.githubusercontent.com/michaelcourcy/kasten-splunk/main/splunk.yaml
This creates a Splunk instance (in its own namespace) and sets up a metrics index (e.g., k8s_metrics) and HEC credentials for ingestion.
2) Deploy an OpenTelemetry Collector in kasten-io
oc create -f https://raw.githubusercontent.com/michaelcourcy/kasten-splunk/main/otel-collector.yaml
The collector scrapes K10’s built-in Prometheus via /federate and sends metrics to Splunk. No sidecars are required on Kasten pods.
Security note: keep the HEC token secret and scope the metrics index narrowly for least privilege.
From PromQL to SPL: model differences
Prometheus uses labels; Splunk uses dimensions. For example, a histogram bucket like:
jobs_duration_bucket{application="k10", service="jobs", status="succeeded", le="60.0"}
In Splunk becomes dimensions available under _dims. You can list them with:
| mcatalog values(_dims) WHERE metric_name=jobs_duration_bucket AND index=k8s_metrics
Focus on the dimensions that actually vary (e.g., status, le) when porting queries.
Counters: don’t sum across bins
Prometheus counters are monotonic, and functions like increase() account for resets. In Splunk, avoid summing the same counter multiple times across time bins. Instead, pick the latest value in each bin, then compute deltas.
Example: number of jobs with duration under 60s by status (failed/succeeded):
| mstats latest(_value) as num_jobs_under_60s
  WHERE index=k8s_metrics metric_name="jobs_duration_bucket" le=60 span=24h earliest=-1h latest=now
  BY status
Use a fixed time window (earliest/latest) larger than your span to ensure you get the latest samples per bin.
Key queries for a practical dashboard
Successful backups over the last 24h
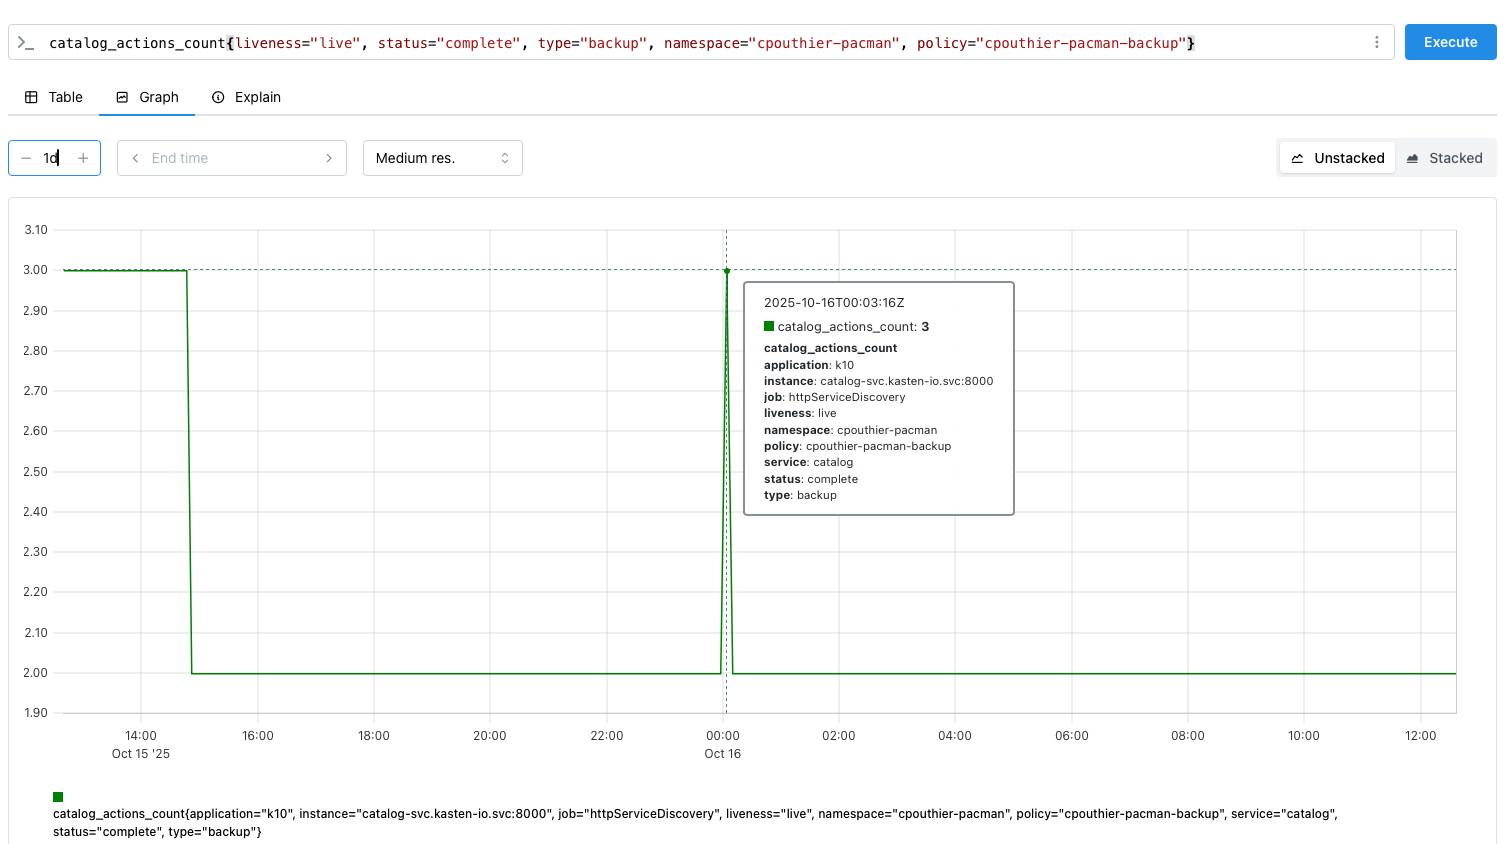
PromQL reference:
increase(catalog_actions_count{liveness="live", status="complete", type="backup"}[24h]) > 0
SPL equivalent using deltas on the counter per namespace/policy:
| mstats latest(_value) AS cum
  WHERE index=k8s_metrics metric_name=catalog_actions_count status=complete type=backup liveness=live
  earliest=-24h latest=now span=1m
  BY namespace, policy
| sort 0 _time namespace, policy
| streamstats current=f last(cum) AS prev BY namespace, policy
| eval inc = if(isnull(prev), 0, cum - prev)
| eval inc = if(inc < 0, 0, inc)
| where inc > 0
This captures only the positive deltas (successful backup events). The timing can be off by up to a couple of minutes due to scrape frequency, bin size, and stream processing.
Optionally, add a rollup:
| stats sum(inc) AS complete_24h
Failed backups over the last 24h
| mstats latest(_value) AS cum
  WHERE index=k8s_metrics metric_name=catalog_actions_count status=failed type=backup liveness=live
  earliest=-24h latest=now span=1m
  BY namespace, policy
| sort 0 _time namespace, policy
| streamstats current=f last(cum) AS prev BY namespace, policy
| eval inc = if(isnull(prev), 0, cum - prev)
| eval inc = if(inc < 0, 0, inc)
| where inc > 0
| stats sum(inc) AS failed_24h
Job duration buckets (≤ 60s) by status
| mstats latest(_value) as num_jobs_under_60s
  WHERE index=k8s_metrics metric_name="jobs_duration_bucket" le=60 span=24h earliest=-1h latest=now
  BY status
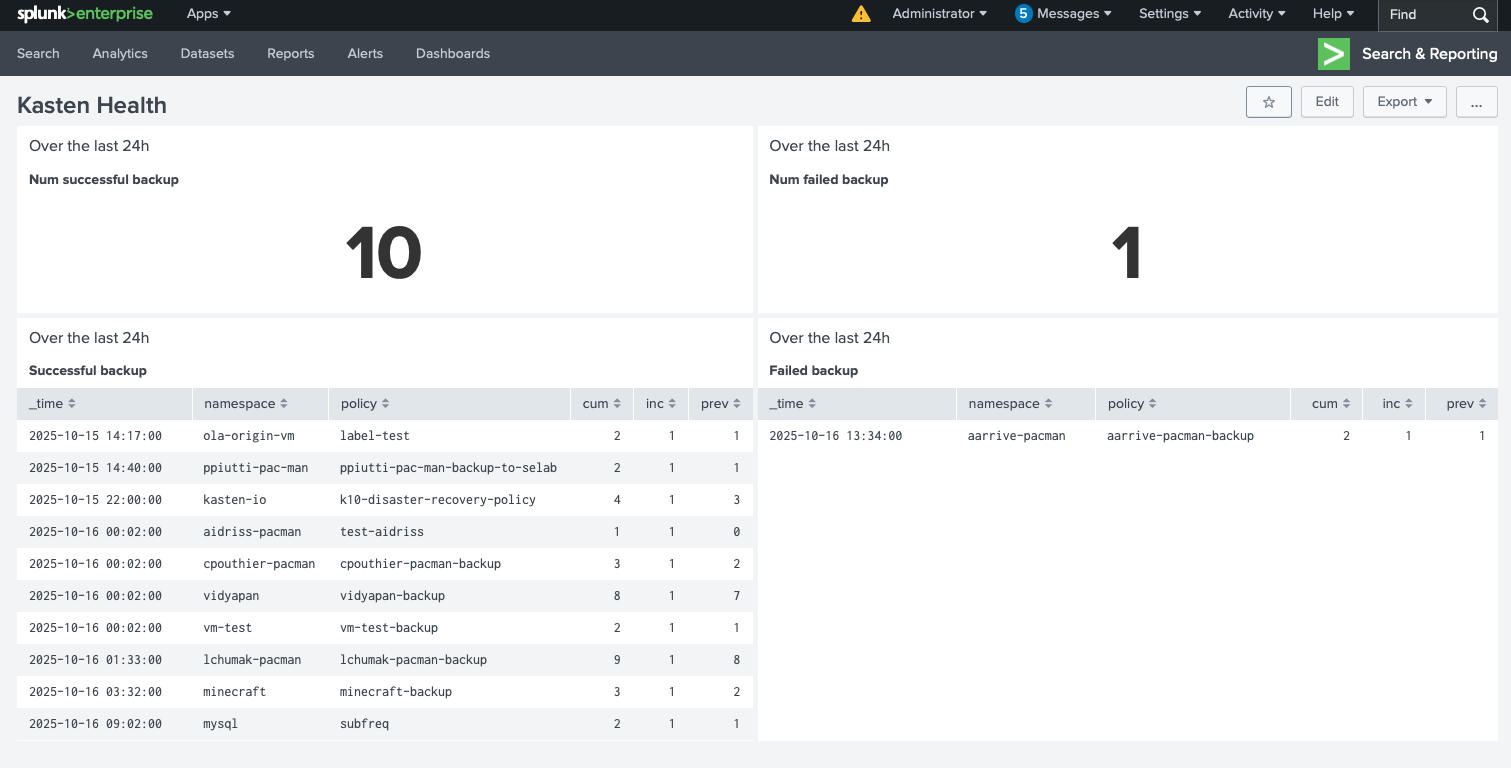
Build the dashboard
With the queries above, you can create a Splunk dashboard that surfaces at-a-glance backup outcomes and trends. For inspiration, see the example in the repo:
If you need broader coverage (e.g., exportactions, runactions, retireactions), translate the corresponding PromQL rules you use today into SPL. A comprehensive set of Kasten rules is documented here:
https://github.com/michaelcourcy/kasten-prometheus-stack/blob/main/kasten-rules.yaml
Troubleshooting tips
- No data in Splunk? Verify HEC token, index name, and network egress from the collector
- Sparse points or off-by-minutes timestamps? Increase scrape frequency and/or reduce
span; keepearliest/latestfixed - Spikey counters? Remember counters can reset; guard with
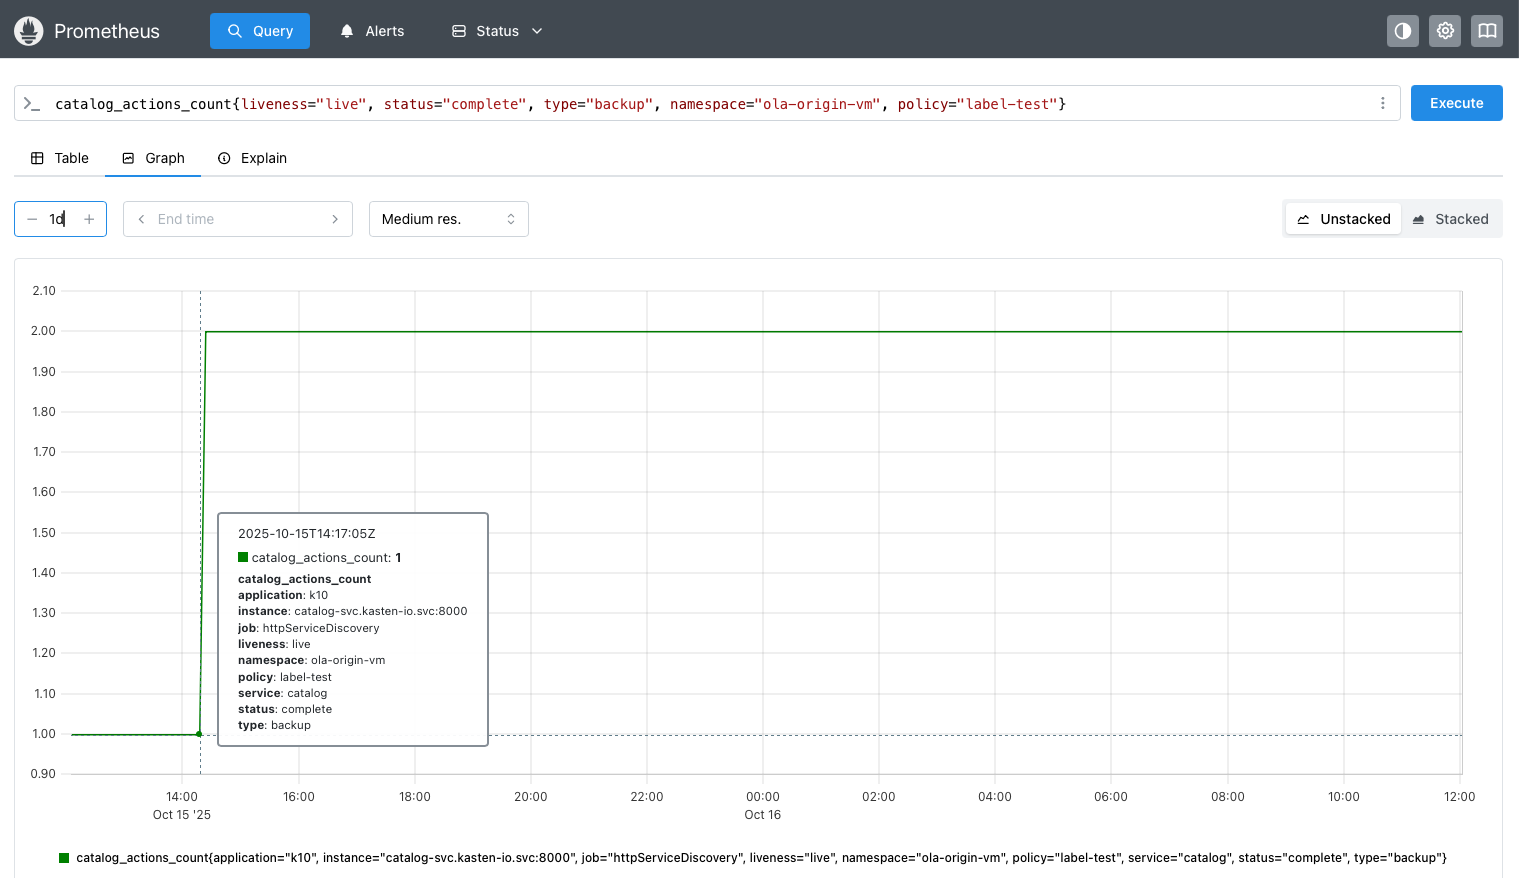
inc = if(inc < 0, 0, inc) - Validate against Prometheus graphs for a sanity check (for example, comparing deltas with Prometheus counter graphs)
Counter reference examples from the repo:
What you get operationally
- Single-pane view of Kasten health within your Splunk workflows
- Faster incident response for failed backups and slow jobs
- Shared language for SRE and SecOps (SPL), while staying truthful to PromQL semantics
- A lightweight, vendor-neutral collection path via Prometheus federate + OpenTelemetry
Resources
- Project: https://github.com/michaelcourcy/kasten-splunk
- Architecture image and dashboard examples are reused from the project repository
- Related Kasten Prometheus rules: https://github.com/michaelcourcy/kasten-prometheus-stack/blob/main/kasten-rules.yaml


