
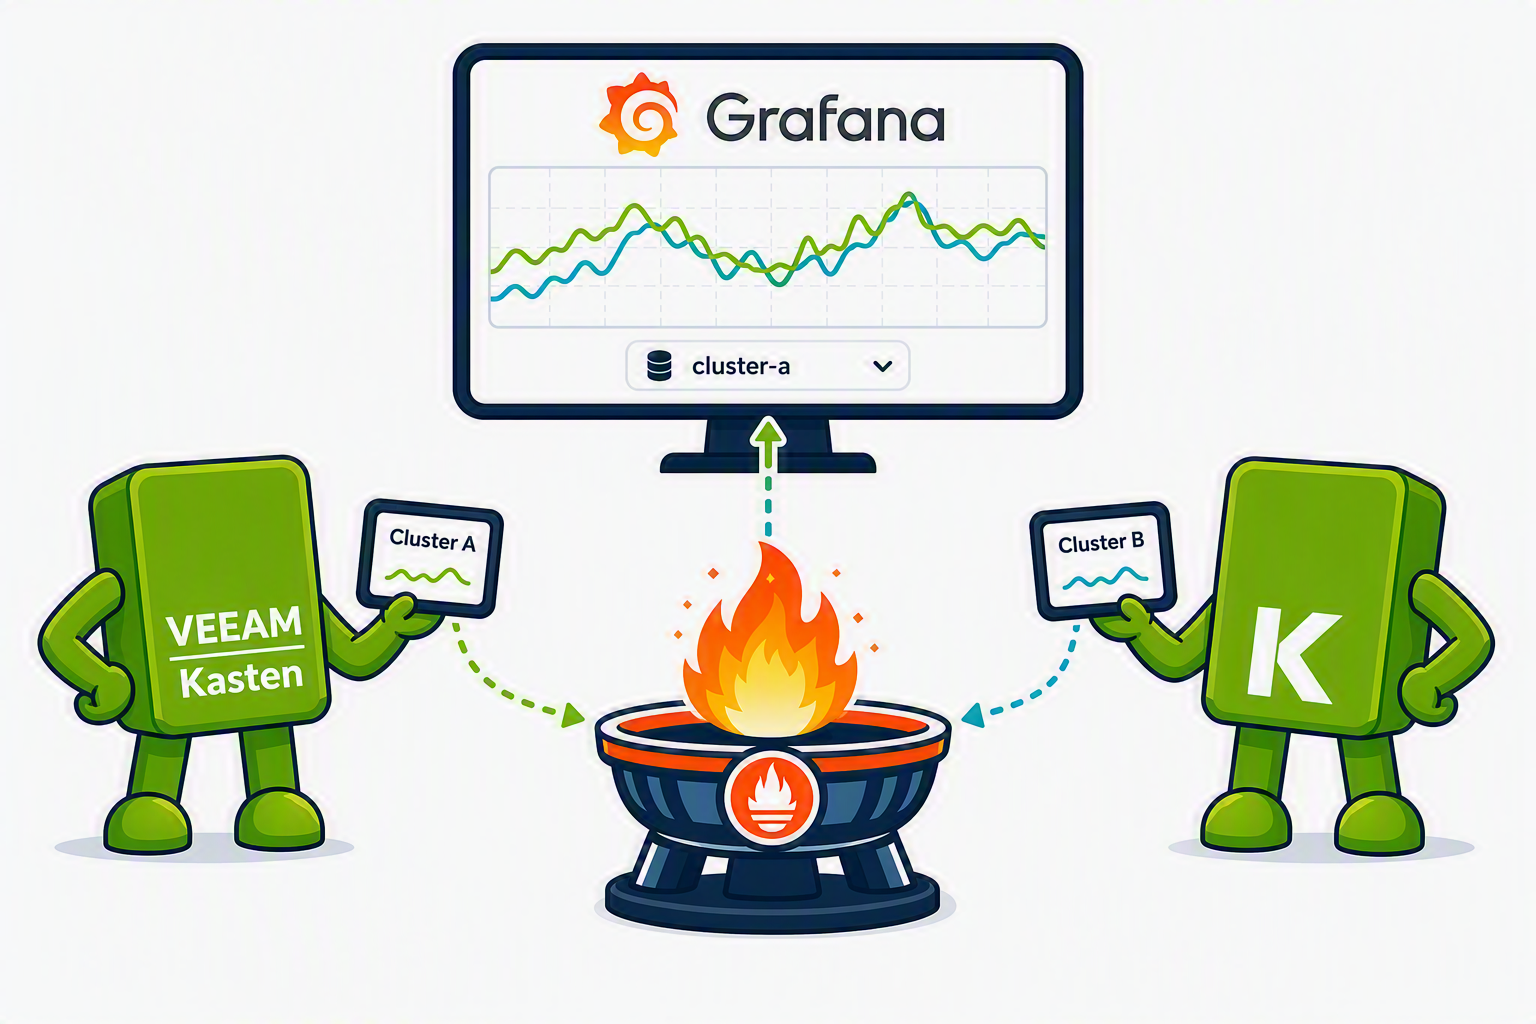



Kasten’s published Grafana dashboard was built to watch one cluster. A dropdown is the only thing standing between that and reusing the same dashboard for every cluster you run — no new dashboard, no per-cluster copies to keep in sync, no mental math figuring out which numbers belong to which environment.
In Part 1, we configured Kasten’s in-cluster Prometheus to send metrics to a centralized backend with remote_write. That solves getting metrics out of each cluster, but it does not provide a view of them.
Kasten already publishes a Grafana dashboard for action completions and failures, action duration, resource utilization, and compliance. The dashboard is designed for a single Veeam Kasten instance. When it is pointed at the multi-cluster backend from Part 1, panels either blend every cluster into one result or double-count data in aggregations such as sum() and increase().
This post shows how to retrofit the published dashboard with two template variables and cluster filtering, rather than build a replacement dashboard from scratch.
This guide is the second piece of a three-part series focused on building an end-to-end, backend-agnostic monitoring setup for Kasten:
- Part 1: Prometheus Remote Write Configuration with Kasten.
- Part 2 (this post): Customizing the Public Kasten Grafana Dashboard for Multi-Cluster Visibility.
- Part 3: Setting up alerting based on Kasten’s exported metrics.
By the end of the series, you will have a repeatable pattern for exporting Kasten metrics from multiple clusters, visualizing them in Grafana, and wiring up alerts.
Why Retrofit Instead of Building a New Dashboard
Kasten’s published dashboard already encodes panels most teams would spend real time redesigning from scratch — including the Execution Control row, which Veeam’s own Performance Troubleshooting Guide (KB4625) uses as its reference point for diagnosing executor and rate-limiter bottlenecks. Worker Load climbing to meet Worker Count is the signal to add more workers (services.executor.workerCount, executorReplicas); Pending count climbing on a Rate Limiter - {operation} panel is the signal that specific operation’s concurrency limit (limiter.csiSnapshots, limiter.genericVolumeSnapshots, and similar) is too tight — not a guess, evidence.
Rebuilding a dashboard from scratch means rebuilding that judgment too. Retrofitting keeps it, along with the existing coverage of applications, backup exports, and resource usage — and only fixes the two things standing in the way of using it across multiple clusters.
Why the published dashboard does not work with a central backend
Two assumptions in the published dashboard break when it is connected to aggregated, multi-cluster data.
Hardcoded data source
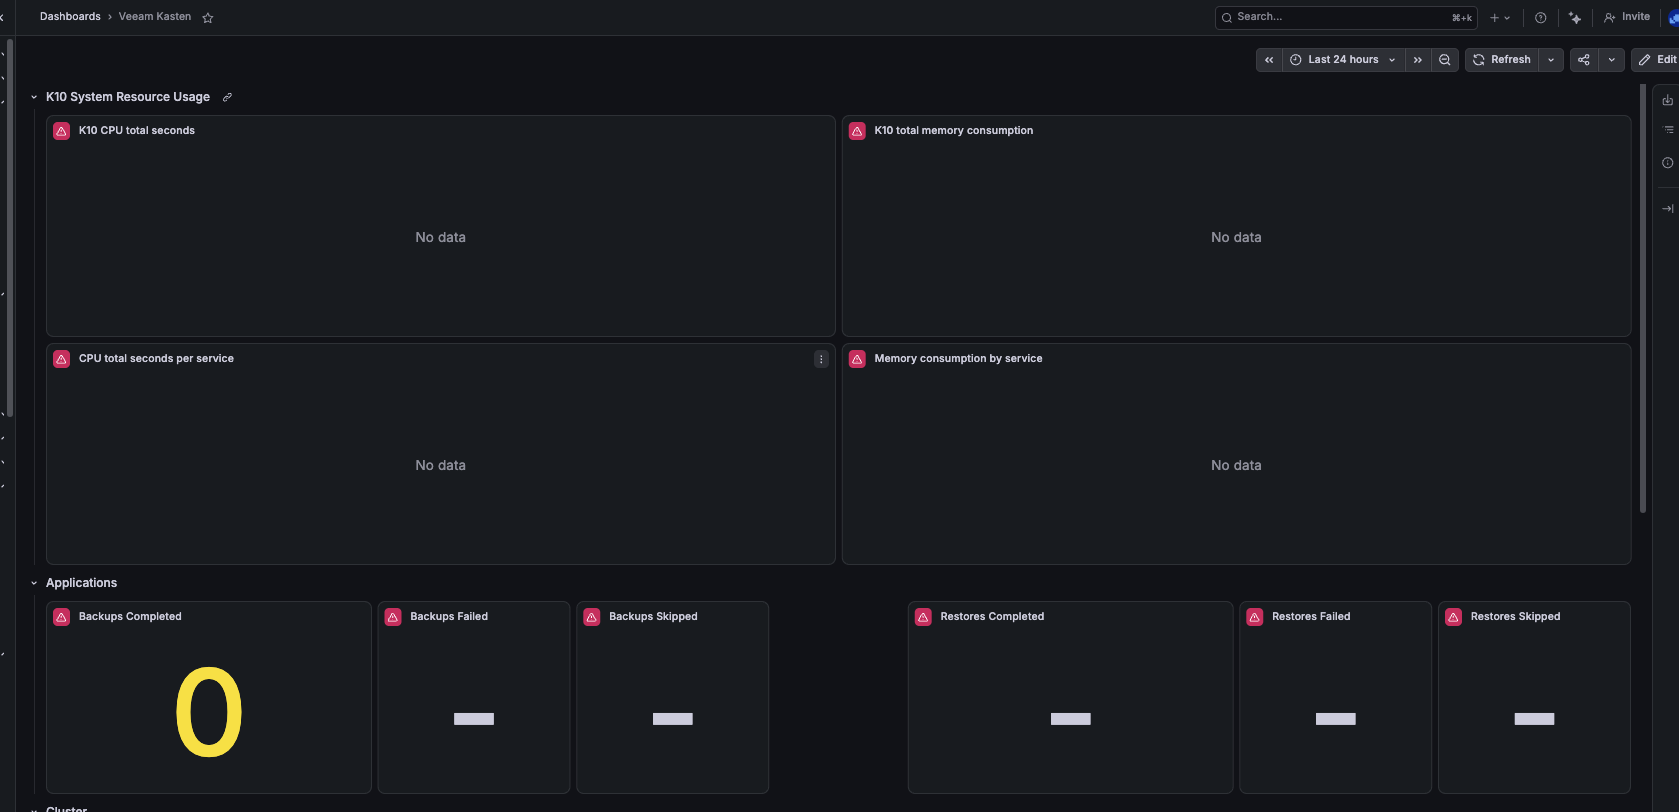
Every panel is bound to a data source named literally Prometheus. If your Grafana instance does not have a data source with that exact name, panels are broken when you import the dashboard. Even when it does, you cannot switch backends without editing every panel.
No cluster filter
None of the panel queries filter on cluster_name, because the dashboard was not intended to see more than one cluster. Import it against your central backend unchanged and you get one of two outcomes:
- Panels showing raw metrics, such as
catalog_persistent_volume_free_space_percent, return blended series with no way to identify their cluster. - Panels using
sum()orincrease(), such as actions failed in the last 24 hours, silently add metrics from every cluster into one figure.
Neither result looks obviously broken. That is why it is worth fixing before relying on the dashboard.
Requirements
Before making any changes, make sure you have the following.
Grafana
- A Grafana instance with permission to edit dashboards.
- The Prometheus-compatible backend from Part 1 added as a Grafana data source.
Kasten dashboard
- The original Kasten dashboard JSON if you want to make the variable and query changes yourself.
- Or the modified dashboard JSON, ready to import directly.
What This Guide Does Not Cover
To keep this part focused on dashboard customization, we are intentionally not covering:
- Installing or configuring Grafana itself.
- Adding a Prometheus-compatible backend as a Grafana data source.
- Alerting on these metrics, which is covered in Part 3.
- Building a Grafana dashboard from scratch.
Setup
Import the modified dashboard
The fast path is to import the modified version of the officially published Kasten dashboard. It retains the same core metrics, adds a few useful panels, and already includes datasource and cluster_name variables.
- In Grafana, go to Dashboards -> New -> Import.
- Download the modified dashboard JSON, then upload it as a file.
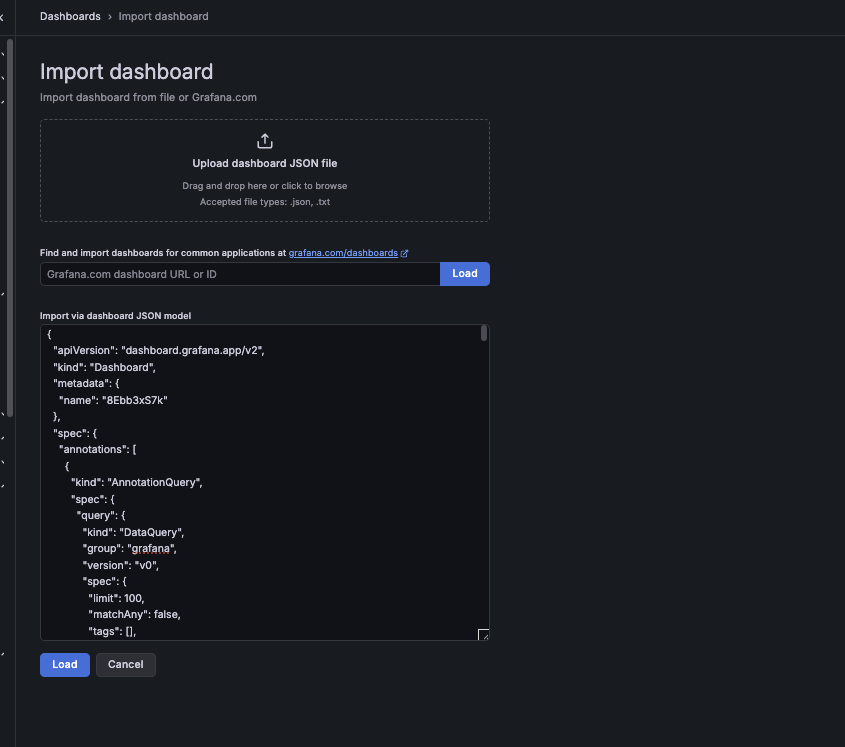
- After import, the
datasourcedropdown defaults to the Grafana instance’s default Prometheus-type data source. Make sure it is set to the Prometheus-compatible backend that holds your Kasten metrics from Part 1.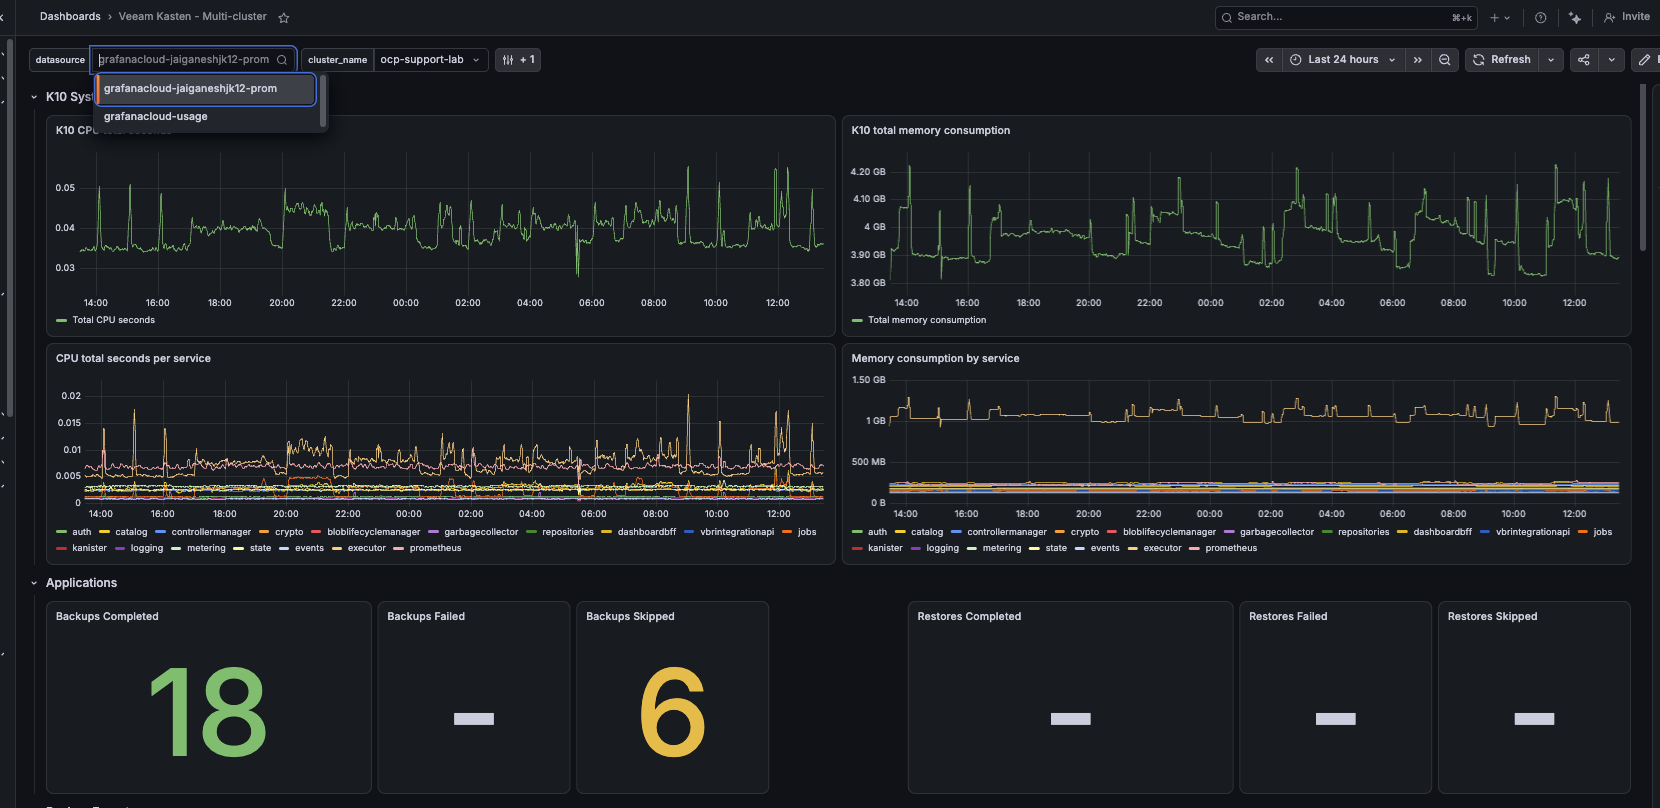
- Use the
cluster_namedropdown at the top of the dashboard to switch between clusters.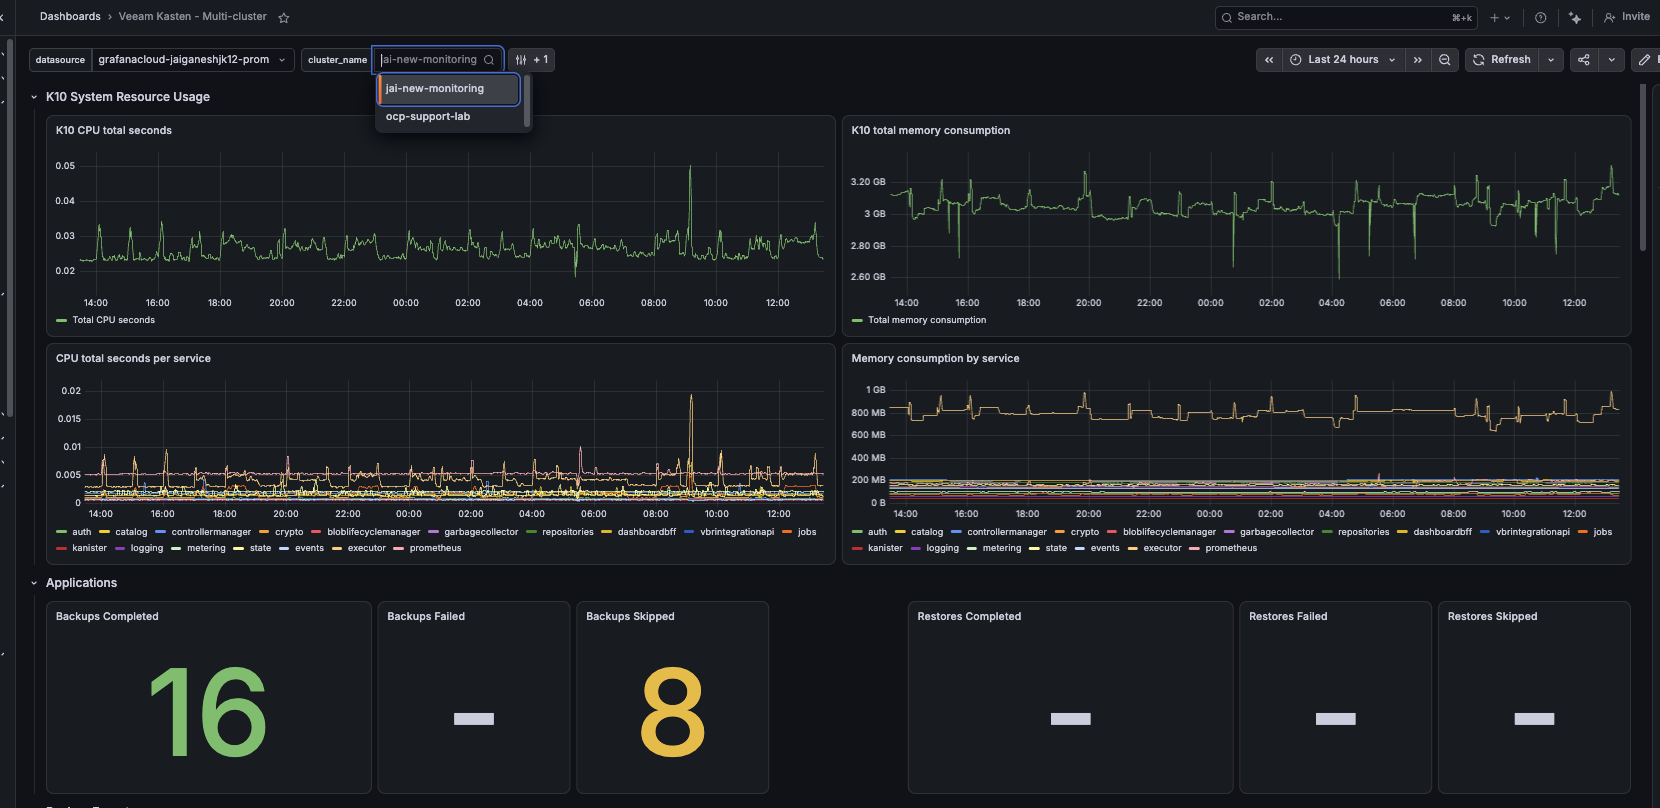
Every panel is already wired to ${datasource} and filtered by cluster_name.
What changed from the original dashboard
There’s a shortcut that looks like it avoids at least the cluster-filtering half of the retrofit: Grafana’s Ad hoc filters (now called “Filter and Group by”) auto-apply to every matching query without editing a single panel. It’s not as intuitive as it sounds, though — and even if you went this route, you’d still need the datasource variable fix from earlier, since ad hoc filters do nothing about the hardcoded data source name. Setting one up means picking the filter’s key from every label the data source has, not just the relevant ones — and that list gets long and unhelpful fast on a shared account with metrics from other services.
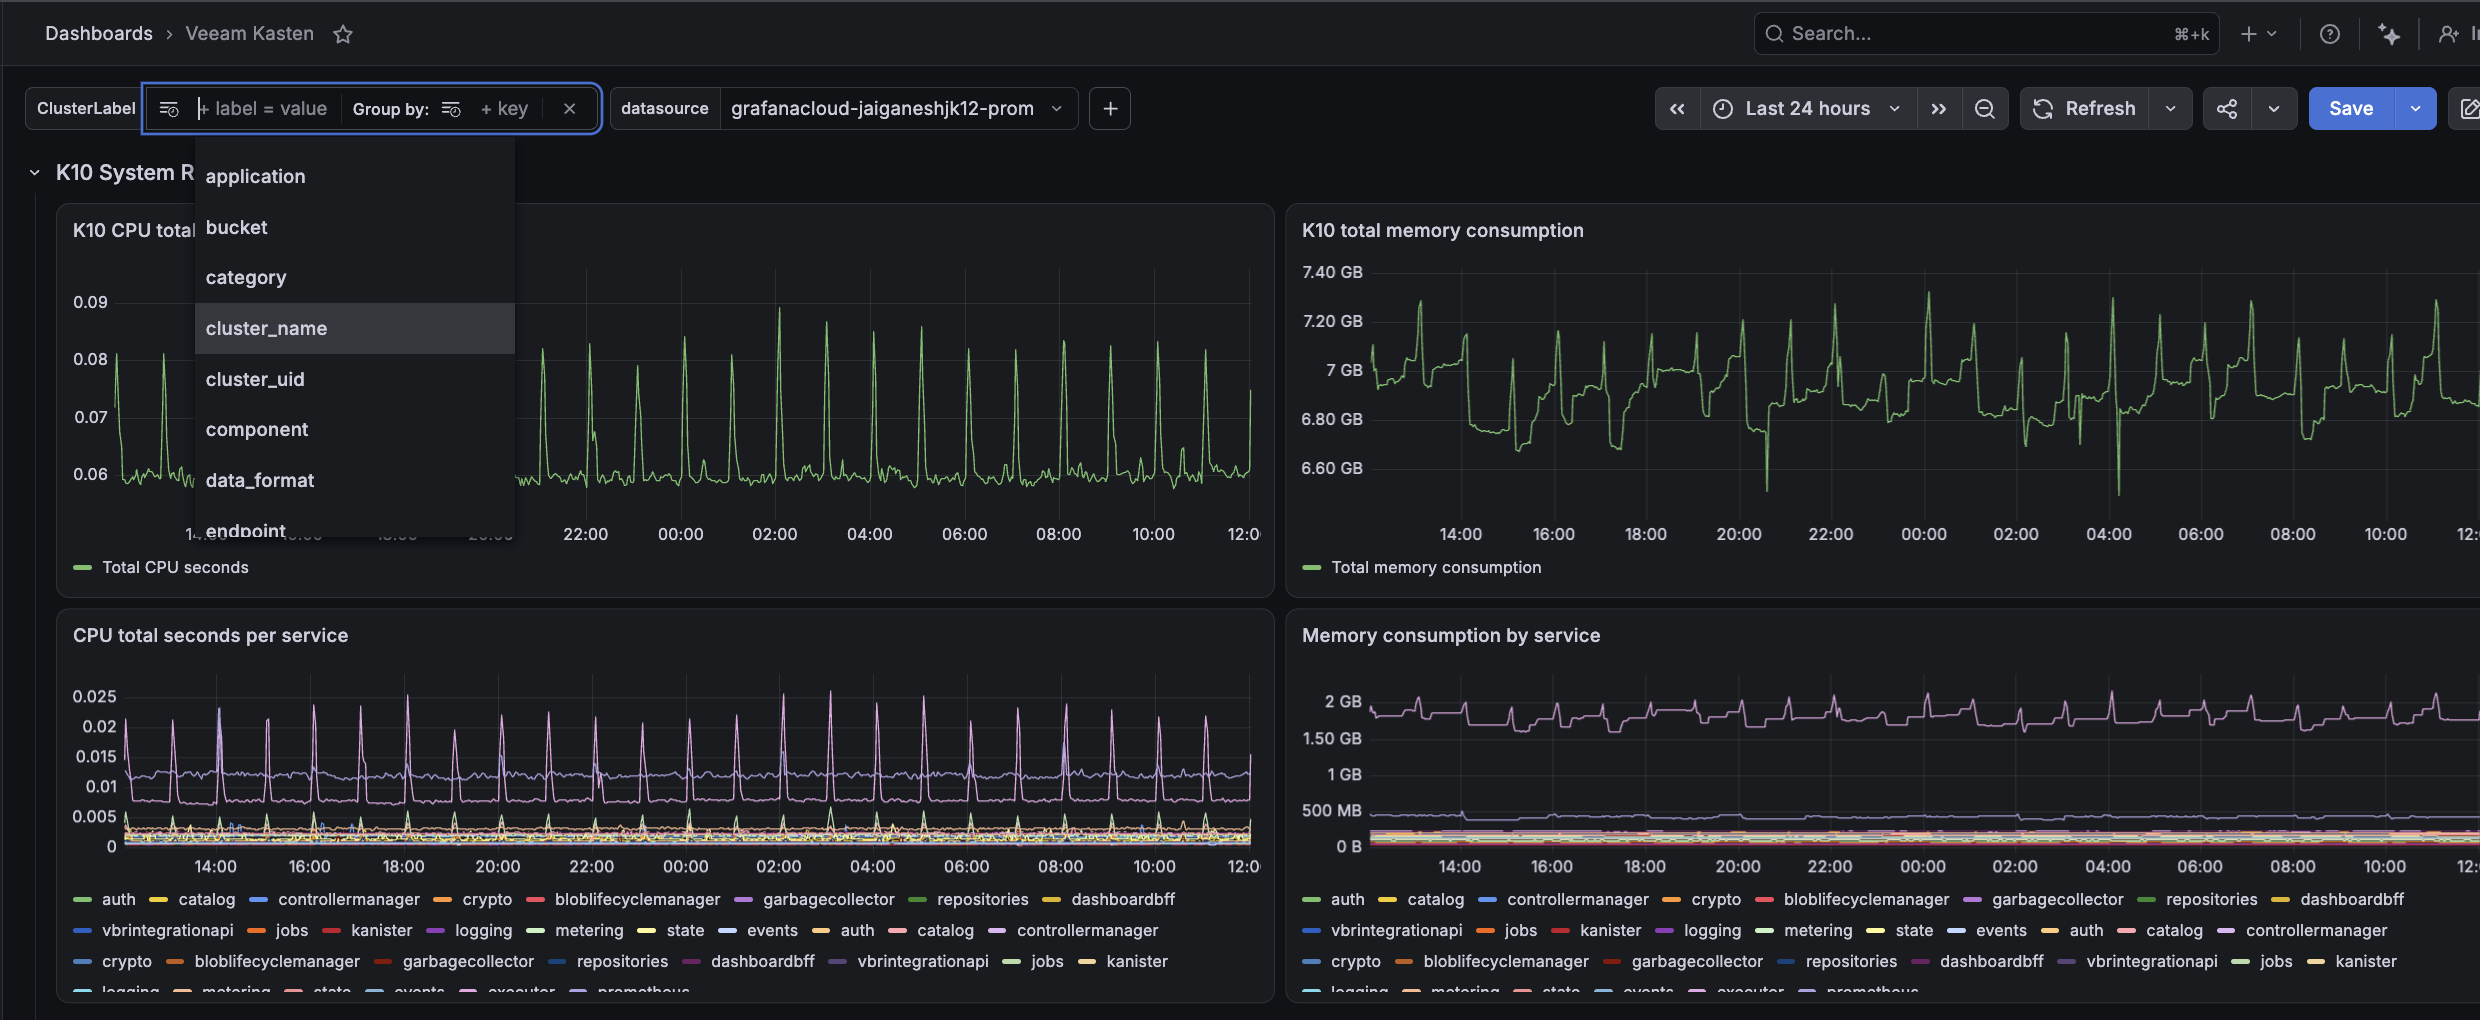
That’s why we used a Query variable instead. Two template variables do the real work here: datasource and cluster_name.
datasource is a Data source-type variable, referenced as ${datasource} in every panel query, so switching the dropdown repoints the entire dashboard at once.
cluster_name is a Query-type variable chained to it, querying label_values(cluster_name). A Query variable is curated once by whoever builds the dashboard, so every reader gets a clean cluster_name dropdown with just the right values, no picking through an unrelated label list first.
Worth being clear about what that query actually does: label_values() only builds the dropdown’s list of options — it doesn’t filter anything on its own. Selecting a cluster doesn’t automatically scope any panel’s data; every panel’s PromQL had to be edited by hand to add cluster_name="$cluster_name". That’s the actual retrofit, not the variable itself.
A few panels beyond the original dashboard were also added, including a table view — worth a look if you want a quick per-policy failure breakdown alongside the stat/timeseries panels.
Verify
Once the dashboard is imported, verify that its variables control every panel correctly.
Switch the data source
Change the datasource dropdown to another Prometheus-compatible backend, if one is available, and confirm that every panel repoints. If a panel still shows the old backend’s data, its data source reference was not updated.
Switch clusters
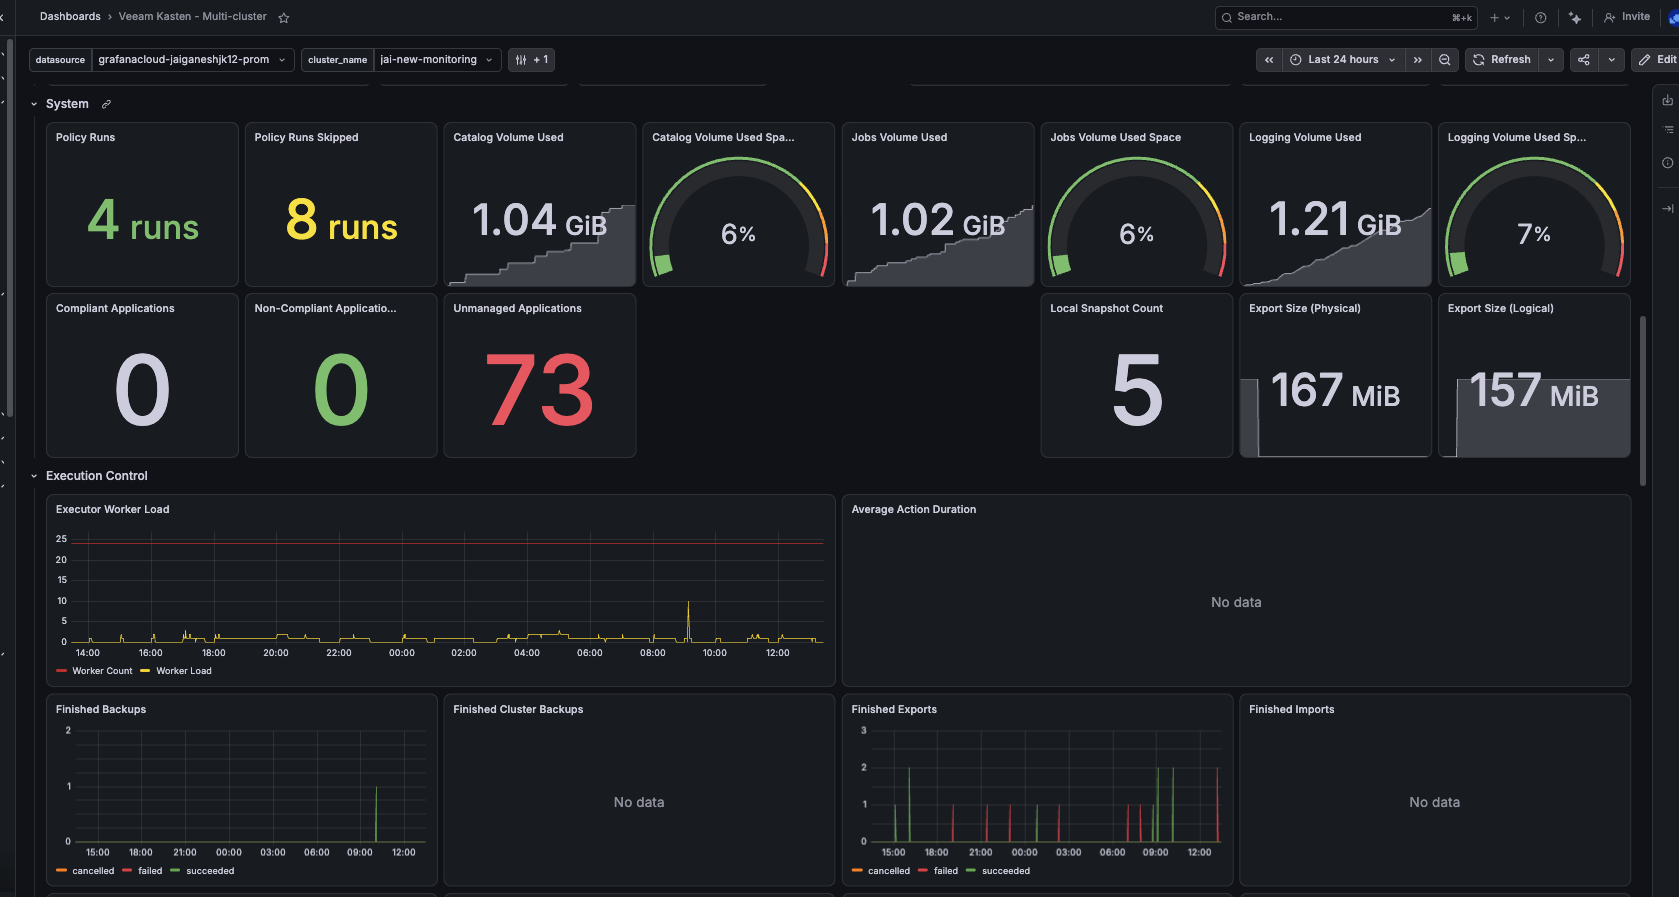
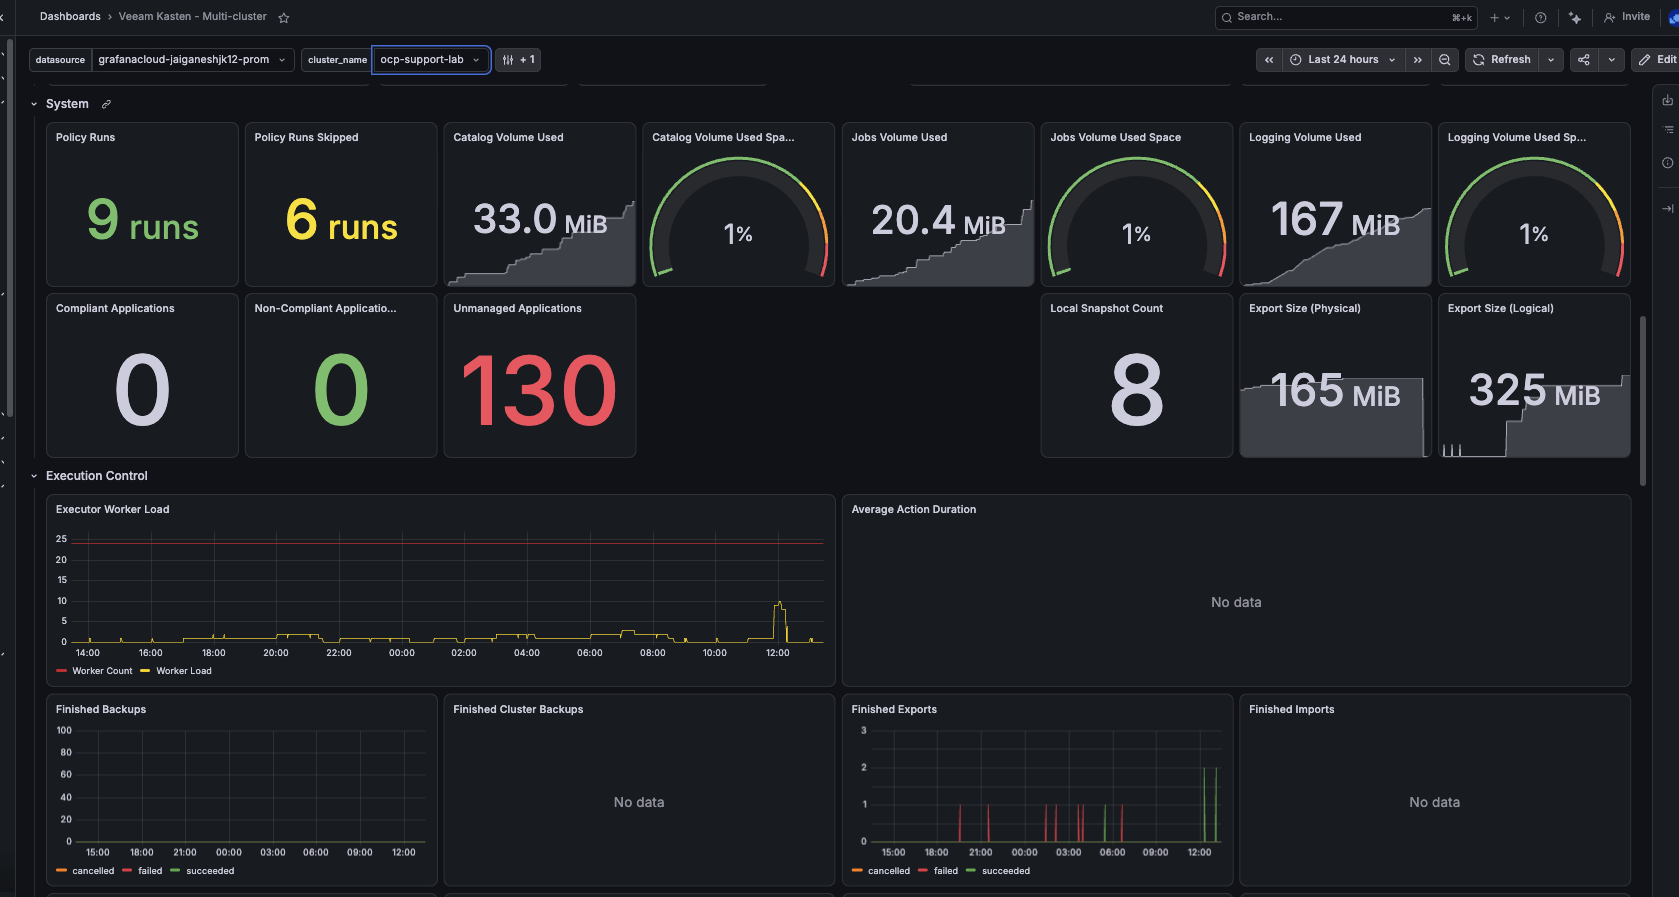
Use the cluster_name dropdown to move between real clusters and confirm that the displayed values change. If every cluster shows identical figures, the cluster filter is not applied to the panel queries.
Dashboard view selecting jai-new-monitoring cluster
Dashboard view selecting ocp-support-lab cluster
Confirm the cluster list
The cluster_name dropdown should show your actual cluster names and nothing else. It obtains its values from: label_values(cluster_name)
If expected clusters are missing, confirm in Grafana Explore that action_ended_total or any of the Kasten metrics include the cluster_name label — for example, with
count by (cluster_name) (action_ended_total)
Wrapping up
You’re no longer stuck treating each cluster’s Kasten metrics as their own separate thing to watch. The same dashboard now works whether you’re looking at one cluster or picking through a fleet — multi-cluster isn’t a workaround you built yourself, it’s just how the dashboard works now.
Next up in the series: turning these metrics into alerts, so you’re not the one staring at the dashboard when something breaks.