


Using openshift monitoring for Kasten
OpenShift monitoring allows you to monitor user metrics, and allow external services like Zabbix or Dynatrace to access those metrics in a secure way.
Typically, before you deploy Kasten to OpenShift, there is already an ITSM stack configured to use OpenShift monitoring. Rather than onboarding Kasten into the ITSM directly, you can include Kasten events within Openshift Monitoring to leverage this already-established integration. This can save you time and effort and be repeated across clusters, to help standardize and simplify monitoring and reporting.
Hence we often have two requests from our customers :
- How do I expose Kasten metrics from an external service like Zabbix or Dynatrace?
- How do I add Kasten metrics in the global OpenShift monitoring?
In this tutorial I’m going to show :
- How to expose user defined metrics to openshift-monitoring
- Query this metrics from an external service using
curl - Apply the previous to Kasten metrics
Enable user metrics
First you need to enable monitoring for user-defined projects.
oc -n openshift-monitoring edit configmap cluster-monitoring-config
Make sure the line enableUserWorkload: true is there.
apiVersion: v1
kind: ConfigMap
metadata:
  name: cluster-monitoring-config
  namespace: openshift-monitoring
data:
  config.yaml: |
    enableUserWorkload: true
if it works then you should see new pods popping up in the openshift-user-workload-monitoring namespace.
oc get po -n openshift-user-workload-monitoring
NAME                                   READY   STATUS    RESTARTS   AGE
prometheus-operator-5bb8ff99b4-wkpxr   2/2     Running   0          7h23m
prometheus-user-workload-0             6/6     Running   0          7h23m
prometheus-user-workload-1             6/6     Running   0          7h23m
thanos-ruler-user-workload-0           3/3     Running   0          7h23m
thanos-ruler-user-workload-1           3/3     Running   0          7h23m
Accessing the metrics from outside the cluster
This part of the OpenShift documentation shows how to access metrics from outside the cluster using curl.
SECRET=`oc get secret -n openshift-user-workload-monitoring | grep  prometheus-user-workload-token | head -n 1 | awk '{print $1 }'`
TOKEN=`echo $(oc get secret $SECRET -n openshift-user-workload-monitoring -o json | jq -r '.data.token') | base64 -d`
THANOS_QUERIER_HOST=`oc get route thanos-querier -n openshift-monitoring -o json | jq -r '.spec.host'`
NAMESPACE=openshift-dns
curl -X GET -kG "https://$THANOS_QUERIER_HOST/api/v1/query?" --data-urlencode "query=up{namespace='$NAMESPACE'}" -H "Authorization: Bearer $TOKEN" | jq
You should get an output like this one
{
  "status": "success",
  "data": {
    "resultType": "vector",
    "result": [
      {
        "metric": {
          "__name__": "up",
          "container": "kube-rbac-proxy",
          "endpoint": "metrics",
          "instance": "10.128.0.38:9154",
          "job": "dns-default",
          "namespace": "openshift-dns",
          "pod": "dns-default-j6n8h",
          "prometheus": "openshift-monitoring/k8s",
          "service": "dns-default"
        },
        "value": [
          1705578106.559,
          "1"
        ]
      },
      {
        "metric": {
          "__name__": "up",
          "container": "kube-rbac-proxy",
          "endpoint": "metrics",
          "instance": "10.128.2.5:9154",
          "job": "dns-default",
          "namespace": "openshift-dns",
          "pod": "dns-default-mf6gk",
          "prometheus": "openshift-monitoring/k8s",
          "service": "dns-default"
        },
        "value": [
          1705578106.559,
          "1"
        ]
      },
  ...
This metrics list all the instances that are scraped in the openshift-dns namespace and their ability to respond to the scrape request.
Let’s create a user defined metrics
Not a bad start, but let’s see what we can do with these metrics. First we create a workload that exposes the metrics:
cat <<EOF |oc create -f -
apiVersion: v1
kind: Namespace
metadata:
  name: ns1
---
apiVersion: apps/v1
kind: Deployment
metadata:
  labels:
    app: prometheus-example-app
  name: prometheus-example-app
  namespace: ns1
spec:
  replicas: 1
  selector:
    matchLabels:
      app: prometheus-example-app
  template:
    metadata:
      labels:
        app: prometheus-example-app
    spec:
      containers:
      - image: ghcr.io/rhobs/prometheus-example-app:0.4.1
        imagePullPolicy: IfNotPresent
        name: prometheus-example-app
---
apiVersion: v1
kind: Service
metadata:
  labels:
    app: prometheus-example-app
  name: prometheus-example-app
  namespace: ns1
spec:
  ports:
  - port: 8080
    protocol: TCP
    targetPort: 8080
    name: web
  selector:
    app: prometheus-example-app
  type: ClusterIP
EOF
To check this pod created metrics, we create a curl pod and grab the metrics using the service created in the previous deployment:
oc run curl --image=curlimages/curl --command --  tail -f /dev/null
oc rsh curl
curl http://prometheus-example-app:8080/metrics
You should see this result:
# HELP version Version information about this binary
# TYPE version gauge
version{version="v0.4.1"} 1
While this particular metric is of little interest, it is a good example and hopefully easy to understand.
Add this metrics in Openshift Monitoring
What is a ServiceMonitor
A ServiceMonitor is a custom resource that composes part of a Prometheus configuration. It is used to define an application you wish to scrape metrics from within Kubernetes. The controller will use the information in the ServiceMonitor object to automatically build the required Prometheus configuration.
The authorization to create a ServiceMonitor
You’ll have to create a cluster role and a binding to allow your user to create the service monitor in their namespace.
First create the servicemonitor-editor cluster role:
cat<<EOF | oc create -f
apiVersion: rbac.authorization.k8s.io/v1
kind: ClusterRole
metadata:
  name: servicemonitor-editor
rules:
- apiGroups:
  - monitoring.coreos.com
  resources:
  - servicemonitors
  verbs:
  - '*'
EOF
Now you can bind this cluster role to a user in a namespace, in our case we want to create the servicemonitor in ns1.
oc create rolebinding servicemonitor-editor-user1 \
  --clusterrole=servicemonitor-editor \
  --user=user1 \
  --namespace=ns1
This binding will allow user1 to create service monitor in the namespace ns1.
Let’s create a Service Monitor for the application we’ve just deployed
Create a monitor to integrate this metric to openshift-monitoring
cat<<EOF | oc create -f -
apiVersion: monitoring.coreos.com/v1
kind: ServiceMonitor
metadata:
  labels:
    k8s-app: prometheus-example-monitor
  name: prometheus-example-monitor
  namespace: ns1
spec:
  endpoints:
  - interval: 30s
    port: web
    scheme: http
  selector:
    matchLabels:
      app: prometheus-example-app
EOF
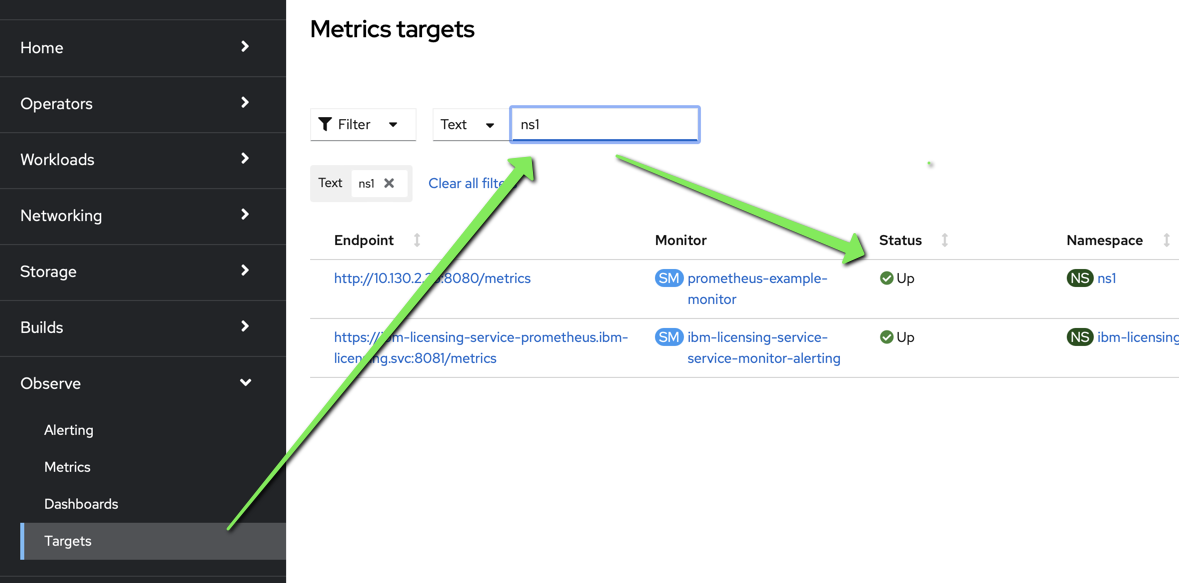
in the OpenShift dashboard, navigate to Observe > Targets and search for ns1 you shoud see this new target.
Access These Metrics from the Outside
As we did before we can now query the metrics generated by this new target from the Thanos host :
SECRET=`oc get secret -n openshift-user-workload-monitoring | grep  prometheus-user-workload-token | head -n 1 | awk '{print $1 }'`
TOKEN=`echo $(oc get secret $SECRET -n openshift-user-workload-monitoring -o json | jq -r '.data.token') | base64 -d`
THANOS_QUERIER_HOST=`oc get route thanos-querier -n openshift-monitoring -o json | jq -r '.spec.host'`
curl -X GET -kG "https://$THANOS_QUERIER_HOST/api/v1/query?" --data-urlencode "query=version" -H "Authorization: Bearer $TOKEN" | jq
you should have this complete response
{
  "status": "success",
  "data": {
    "resultType": "vector",
    "result": [
      {
        "metric": {
          "__name__": "version",
          "endpoint": "web",
          "instance": "10.130.2.35:8080",
          "job": "prometheus-example-app",
          "namespace": "ns1",
          "pod": "prometheus-example-app-6884c645b9-gl2mm",
          "prometheus": "openshift-user-workload-monitoring/user-workload",
          "service": "prometheus-example-app",
          "version": "v0.4.1"
        },
        "value": [
          1704813472.324,
          "1"
        ]
      }
    ]
  }
}
Apply to Kasten
Allow openshift monitoring to scrape kasten-io namespace
First we need to allow request coming from the openshift-user-workload-monitoring namespace, for that we need to add a network policy in the kasten-io namespace.
cat<<EOF |oc create -f -
apiVersion: networking.k8s.io/v1
kind: NetworkPolicy
metadata:
  labels:
    app: k10
  name: allow-openshift-monitoring
  namespace: kasten-io
spec:
  ingress:
  - from:
    - namespaceSelector:
        matchLabels:
          name: openshift-user-workload-monitoring
  - ports:
    - port: http
      protocol: TCP
  podSelector:
    matchLabels:
      release: k10
  policyTypes:
  - Ingress
EOF
Check you can request the metrics endpoint in kasten from the openshift-user-workload-monitoring namespace by shelling in one of his prometheus pod.
oc rsh -n openshift-user-workload-monitoring prometheus-user-workload-0
curl http://catalog-svc.kasten-io.svc.cluster.local:8000/metrics
If you get a response, it means that you’ve successfully allowed communication to kasten-io from the openshift-user-workload-monitoring.
Create a Service Monitor
Now let’s create a service monitor for the catalog. We do that for this specific component because it’s the catalog that publish the metrics about kasten actions. There is other metrics published by other Kasten components but the catalog hold the most important from an operation standpoint.
cat<<EOF | oc create -f -
apiVersion: monitoring.coreos.com/v1
kind: ServiceMonitor
metadata:
  labels:
    k8s-app: kasten-io
  name: catalog
  namespace: kasten-io
spec:
  endpoints:
  - interval: 30s
    port: http
    scheme: http
  selector:
    matchLabels:
      component: catalog
EOF
After some time you should be able to query the catalog_actions_count metrics from the openshift monitoring service
SECRET=`oc get secret -n openshift-user-workload-monitoring | grep  prometheus-user-workload-token | head -n 1 | awk '{print $1 }'`
TOKEN=`echo $(oc get secret $SECRET -n openshift-user-workload-monitoring -o json | jq -r '.data.token') | base64 -d`
THANOS_QUERIER_HOST=`oc get route thanos-querier -n openshift-monitoring -o json | jq -r '.spec.host'`
curl -X GET -kG "https://$THANOS_QUERIER_HOST/api/v1/query?" --data-urlencode "query=catalog_actions_count" -H "Authorization: Bearer $TOKEN" |jq
You should get an answer like this one (Unless you did not trigger any Kasten actions):
If you don’t see a response similar to the one below, it’s likely because you have not triggered any actions (e.g. Backup, export, restore, etc) within Kasten. If you do so, then re-run the above commands, you should hopefully see a similar response.
{
  "status": "success",
  "data": {
    "resultType": "vector",
    "result": [
      {
        "metric": {
          "__name__": "catalog_actions_count",
          "container": "catalog-svc",
          "endpoint": "http",
          "exported_namespace": "bnewell-pacman",
          "instance": "10.131.1.77:8000",
          "job": "catalog-svc",
          "liveness": "live",
          "namespace": "kasten-io",
          "pod": "catalog-svc-56b97b4bfb-7vrzc",
          "policy": "bnewell-pacman-backup",
          "prometheus": "openshift-user-workload-monitoring/user-workload",
          "service": "catalog-svc",
          "status": "complete",
          "type": "backup"
        },
        "value": [
          1705579479.262,
          "3"
        ]
      },
      {
        "metric": {
          "__name__": "catalog_actions_count",
          "container": "catalog-svc",
          "endpoint": "http",
          "exported_namespace": "bnewell-pacman",
          "instance": "10.131.1.77:8000",
          "job": "catalog-svc",
          "liveness": "live",
          "namespace": "kasten-io",
          "pod": "catalog-svc-56b97b4bfb-7vrzc",
          "policy": "bnewell-pacman-backup",

          ..... Continue ....
The important part of the curl request is :
"query=catalog_actions_count"
catalog_action_count is a metric exposed by the catalog, it give the status of the Kasten actions.
Detecting a failed action
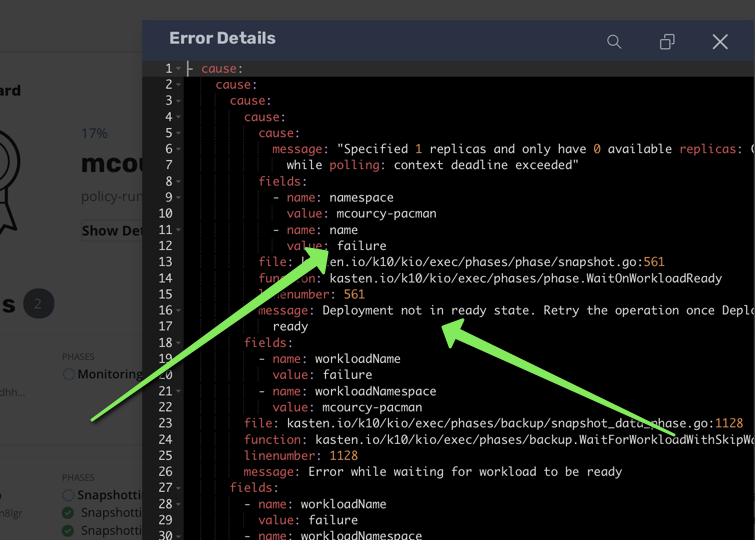
In order to test a failed action I’m going to fail a backup in one of the applications
by creating a failed workload in the mcourcy-pacman namespace. Kasten will wait for the deployment to be ready and after a while it will fail the backup.
mcourcy-pacman is a namespace which is protected by a Kasten backup policy. When I run this policy, the backup action will fail because of the failed workload.
oc create deployment -n mcourcy-pacman failure --image=alpine -- i_am_not_a_command_this_will_fail_the_workload
You should see the error
oc get po -n mcourcy-pacman
NAME                              READY   STATUS                 RESTARTS        AGE
failure-f8698c76d-9drv5           0/1     CreateContainerError   0               43s
pacman-79cbb686d7-fntgg           1/1     Running                1 (28d ago)     28d
pacman-mongodb-67fffc6787-7fzgx   1/1     Running                2 (2d20h ago)   28d
Now take a backup, Kasten will wait for the deployment to be ready and after a while it will fail the backup.
Make sure the failed actions are now populated in openshift-monitoring
I will query the failed action from openshift monitoring as we did before but I will use a criteria policy='mcourcy-pacman-backup' to narrow my search.
query=catalog_actions_count{status='failed',policy='mcourcy-pacman-backup'}
Let’s repeat the complete action to query from Thanos:
SECRET=`oc get secret -n openshift-user-workload-monitoring | grep  prometheus-user-workload-token | head -n 1 | awk '{print $1 }'`
TOKEN=`echo $(oc get secret $SECRET -n openshift-user-workload-monitoring -o json | jq -r '.data.token') | base64 -d`
THANOS_QUERIER_HOST=`oc get route thanos-querier -n openshift-monitoring -o json | jq -r '.spec.host'`
curl -X GET -kG "https://$THANOS_QUERIER_HOST/api/v1/query?" --data-urlencode "query=catalog_actions_count{status='failed',policy='mcourcy-pacman-backup'}" -H "Authorization: Bearer $TOKEN" |jq
you should get a similar output :
{
  "status": "success",
  "data": {
    "resultType": "vector",
    "result": [
      {
        "metric": {
          "__name__": "catalog_actions_count",
          "container": "catalog-svc",
          "endpoint": "http",
          "exported_namespace": "mcourcy-pacman",
          "instance": "10.131.1.77:8000",
          "job": "catalog-svc",
          "liveness": "live",
          "namespace": "kasten-io",
          "pod": "catalog-svc-56b97b4bfb-7vrzc",
          "policy": "mcourcy-pacman-backup",
          "prometheus": "openshift-user-workload-monitoring/user-workload",
          "service": "catalog-svc",
          "status": "failed",
          "type": "backup"
        },
        "value": [
          1705076841.476,
          "2"
        ]
      }
    ]
  }
}
check the timestamp 1705076841.476, and convert it in a human readable format.
date -d @1705076841.476
Fri Jan 12 17:27:21 CET 2024
If you are on mac
brew install coreutils
gdate -d @1705076841.476
Fri Jan 12 17:27:21 CET 2024
The date and time should be the date and time of the failed backup. The number 2 in the earlier response is because we have a failed backup action and also a failed runaction because we trigger the backup action from a policy.
Now try the same query but add a range selector of 10 minutes :
"query=catalog_actions_count{status='failed',policy='mcourcy-pacman-backup'}[10m]"
you’ll get something like this
 {
  "status": "success",
  "data": {
    "resultType": "matrix",
    "result": [
      {
        "metric": {
          "__name__": "catalog_actions_count",
          "container": "catalog-svc",
          "endpoint": "http",
          "exported_namespace": "mcourcy-pacman",
          "instance": "10.131.1.77:8000",
          "job": "catalog-svc",
          "liveness": "live",
          "namespace": "kasten-io",
          "pod": "catalog-svc-56b97b4bfb-7vrzc",
          "policy": "mcourcy-pacman-backup",
          "prometheus": "openshift-user-workload-monitoring/user-workload",
          "service": "catalog-svc",
          "status": "failed",
          "type": "backup"
        },
        "values": [
          [
            1705335629.842,
            "2"
          ],
          [
            1705335636.32,
            "2"
          ],
          [
            1705335659.842,
            "2"
          ],
          [
            1705335689.842,
            "3"
          ],
          [
            1705335719.842,
            "3"
          ],
          [
            1705335749.842,
            "4"
          ],
          [
            1705335779.842,
            "4"
          ],
          ....
What we get here is a range vector rather than an instant vector. Which means exactly the same result before but evaluated at different times within the 10 last minutes.
The interesting thing that you may notice is the value change at the end of the range vector, we moved from 2 to 3 then 4.
20 minutes after the failed backup if you reevaluate this expression you will get only 4 for all the response metric values.
Some prometheus function like increase work with range vector and in this case it squashes the result into an instant vector back.
for instance
"query=increase(catalog_actions_count{policy='mcourcy-pacman-backup',status='failed'}[10m])"
Will return an instant vector showing the evolution of the number of failed backup within the 10 minutes :
{
  "status": "success",
  "data": {
    "resultType": "vector",
    "result": [
      {
        "metric": {
          "container": "catalog-svc",
          "endpoint": "http",
          "exported_namespace": "mcourcy-pacman",
          "instance": "10.131.1.77:8000",
          "job": "catalog-svc",
          "liveness": "live",
          "namespace": "kasten-io",
          "pod": "catalog-svc-56b97b4bfb-7vrzc",
          "policy": "mcourcy-pacman-backup",
          "prometheus": "openshift-user-workload-monitoring/user-workload",
          "service": "catalog-svc",
          "status": "failed",
          "type": "backup"
        },
        "value": [
          1705356529.062,
          "1.0526315789473684"
        ]
      }
    ]
  }
}
The result will be zero if you’ve passed the 10 minutes after the failure
{
  "status": "success",
  "data": {
    "resultType": "vector",
    "result": [
      {
        "metric": {
          "container": "catalog-svc",
          "endpoint": "http",
          "exported_namespace": "mcourcy-pacman",
          "instance": "10.131.1.77:8000",
          "job": "catalog-svc",
          "liveness": "live",
          "namespace": "kasten-io",
          "pod": "catalog-svc-56b97b4bfb-7vrzc",
          "policy": "mcourcy-pacman-backup",
          "prometheus": "openshift-user-workload-monitoring/user-workload",
          "service": "catalog-svc",
          "status": "failed",
          "type": "backup"
        },
        "value": [
          1705357729.062,
          "0"
        ]
      }
    ]
  }
}
The non integer value 1.0526315789473684 is because even if we see a change from 2 to 4 on a time range this is seen as a gradual change on the 10 minutes. If instead of [10m] you choose [5m] in the query, the value would be higher because the change is seen as quicker hence more abrupt.
        "value": [
          1705356529.062,
          "1.25"
        ]
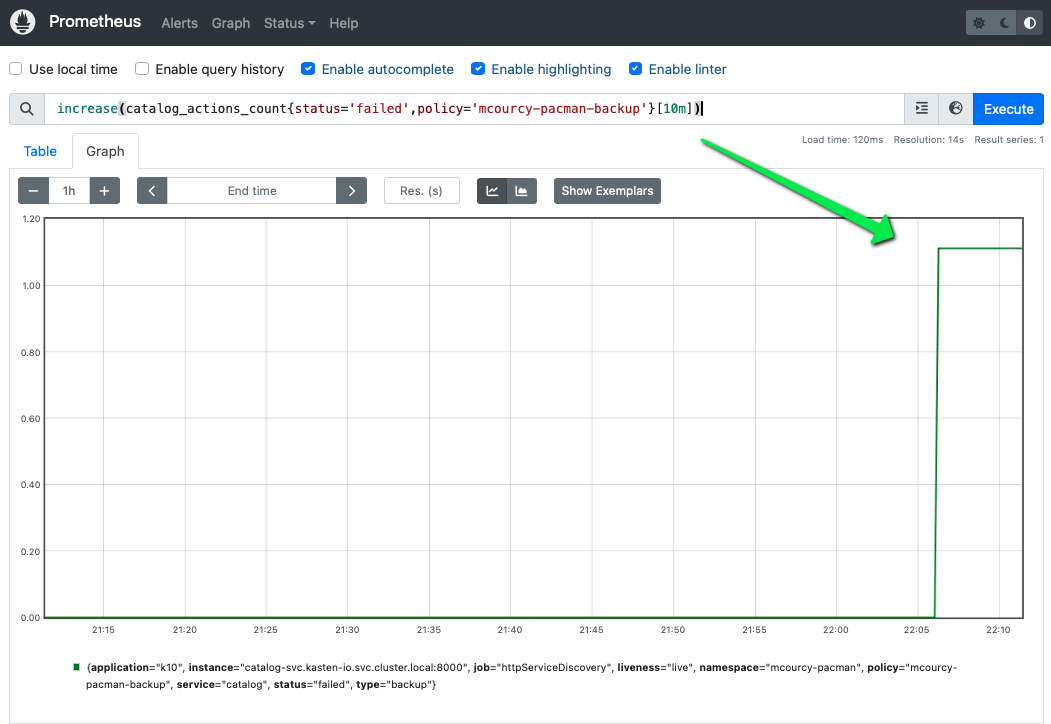
You can also create a graph in the promethus UI to get a better visibility of this signal.
Within the 10 minutes of the backup the number of failed backup increase :
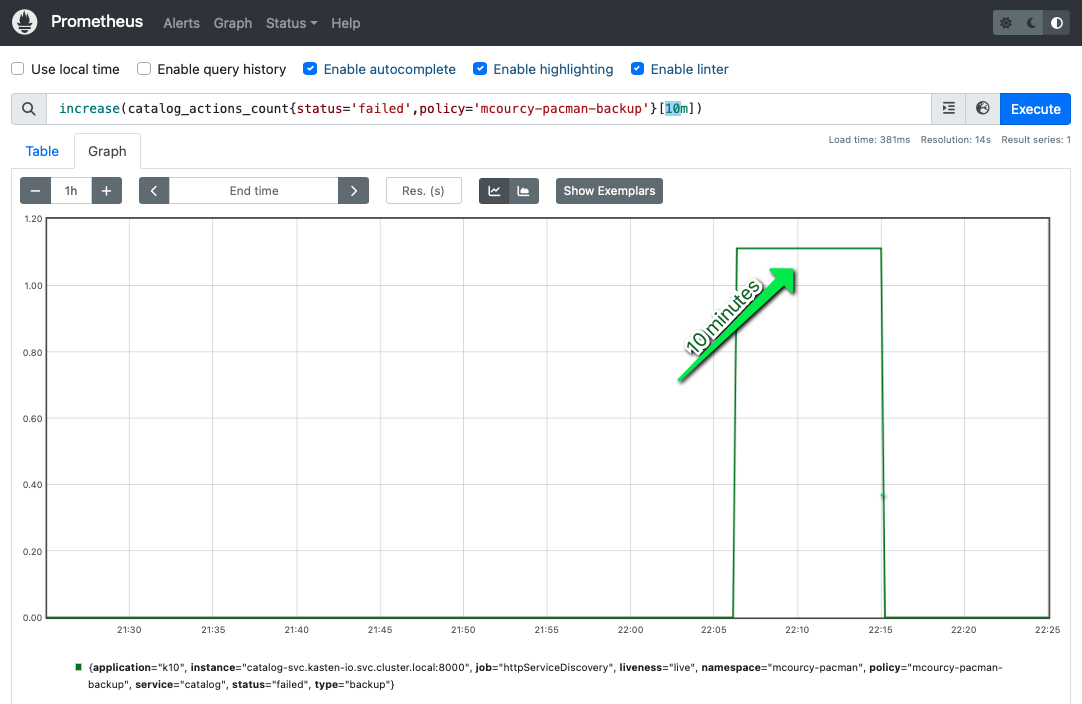
But after 10 minutes the increase eval again to zero:
From an alerting point of view, what you need to do at the end is to capture when this expression will be true
increase(catalog_actions_count{status='failed'}[10m])>0
This expression is a binary selector selector, if it evaluates to true it will return the instant vector that satifies the condition > 0.
{
  "status": "success",
  "data": {
    "resultType": "vector",
    "result": [
      {
        "metric": {
          "container": "catalog-svc",
          "endpoint": "http",
          "exported_namespace": "mcourcy-pacman",
          "instance": "10.131.1.77:8000",
          "job": "catalog-svc",
          "liveness": "live",
          "namespace": "kasten-io",
          "pod": "catalog-svc-56b97b4bfb-7vrzc",
          "policy": "mcourcy-pacman-backup",
          "prometheus": "openshift-user-workload-monitoring/user-workload",
          "service": "catalog-svc",
          "status": "failed",
          "type": "backup"
        },
        "value": [
          1705356529.062,
          "1.0526315789473684"
        ]
      }
    ]
  }
}
In other words the exact result we get before, otherwise it just return an empty set
{
  "status": "success",
  "data": {
    "resultType": "vector",
    "result": []
  }
}
Getting an empty resultset means that the number of failed action did not increase in the last 10 minutes.
Garbage collection of the metrics
Even long after the backup failure if you execute the request
"query=increase(catalog_actions_count{policy='mcourcy-pacman-backup',status='failed'}[10m])"
You’ll notice the dates are still recent and within the last 10 minutes, despite the failure having occurred in the past. The catalog will continue to publish the metrics or the actions, and prometheus continue to scrape them.
When a restore point is retired the corresponding backup action is also retired, but when a backup action failed there is no restore point. In this case the failed backup action will remain until retired by the global garbage collector.
Capturing Other Interesting Failures
It’s worth noting that Kasten deploys an instance of Grafana when it is installed. You can use the Kasten Grafana dashboard to obtain other interesting alerts.
Not using more than 50 % of catalog pvc
For instance, perhaps you want to generate an alert if your cluster’s storage is over 50% utilized:
100-catalog_persistent_volume_free_space_percent>50
If the result is empty you are under 50%.
Evaluating the quantity of memory and CPU used by kasten-io
Another useful monitor may be monitoring the amount of compute consumed by resources in the kasten-io namespace. This can help us size our cluster appropriately and monitor resource utilization over time as we increase or decrease the number of applications, replicas, etc being backed up by Kasten.
sum(container_memory_working_set_bytes{namespace='kasten-io',container="",pod!=""}) BY (namespace)
or
curl -X GET -kG "https://$THANOS_QUERIER_HOST/api/v1/query?" --data-urlencode "query=sum(container_memory_working_set_bytes{namespace='kasten-io',container='',pod!=''}) BY (namespace)" -H "Authorization: Bearer $TOKEN" |jq
the result here
{
  "status": "success",
  "data": {
    "resultType": "vector",
    "result": [
      {
        "metric": {
          "namespace": "kasten-io"
        },
        "value": [
          1705359310.344,
          "2776227840"
        ]
      }
    ]
  }
}
Show that kasten consumme 2.8Gb of memory.
In order to detect an unexpected issue on memory usage, you can configure a metric to detect whether Kasten memory usage surpasses 3Gb. If it has not, this request will return an empty result.
sum(container_memory_working_set_bytes{namespace='kasten-io',container="",pod!=""}) BY (namespace) > 3221225472

{
  "status": "success",
  "data": {
    "resultType": "vector",
    "result": []
  }
}
Otherwise, you know that Kasten is exceeding the 3Gb threshold.
The same can apply for Kasten’s cpu usage as well:
namespace:container_cpu_usage:sum{namespace='kasten-io'}
And here is the same query, this time using Thanos:
curl -X GET -kG "https://$THANOS_QUERIER_HOST/api/v1/query?" --data-urlencode "query=namespace:container_cpu_usage:sum{namespace='kasten-io'}" -H "Authorization: Bearer $TOKEN" |jq
Conclusion
Thanks to Prometheus ServiceMonitor, it’s easy to integrate Kasten metrics into OpenShift monitoring and ensure that metrics and alerts on kasten-io will be accessible and visible to your organization.


